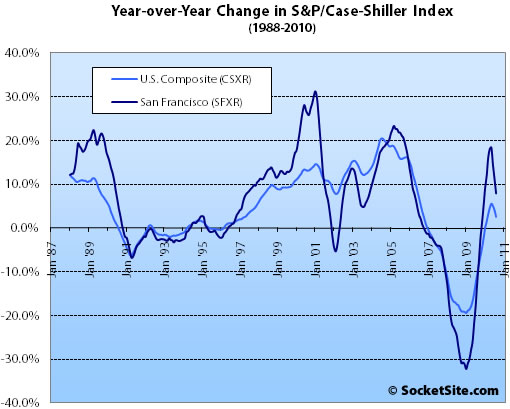
According to the August 2010 S&P/Case-Shiller Home Price Index, single-family home prices in the San Francisco MSA fell 0.3% from July ’10 to August ’10, down 34.6% from a peak in May 2006 and up 7.8% year-over-year (YOY) versus a 11.2% YOY gain reported in July and 14.3% in June.
For the broader 10-City composite (CSXR), home values fell a nominal 0.1% from July to August and remain down 28.3% from a peak in June 2006 as the year-over-year gain slipped to 2.6%.
“A disappointing report. Home prices broadly declined in August. Seventeen of the 20 cities and both Composites saw a weakening in year-over-year figures, as compared to July, indicating that the housing market continues to bounce along the recent lows,” says David M. Blitzer, Chairman of the Index Committee at Standard & Poor’s. “Over the last four months both the 10- and 20-City Composites show slowing growth, after sustaining consistent gains since their April 2009 troughs.
“The month-over-month growth rates tell the same story. Fifteen of the 20 MSAs and the two Composites saw a decline in the month of August as compared to July levels. The 10- and 20-City Composites fell 0.1% and 0.2%, respectively. Indeed, the housing market appears to have stabilized at new lows. At this time, it does not seem that any of the markets are hanging on to the temporary momentum caused by the homebuyers’ tax credits.”
Prices fell across all three price tiers on a month-over-month basis for single-family homes in the San Francisco MSA for the first time in six months as year-over-year gains also slid.
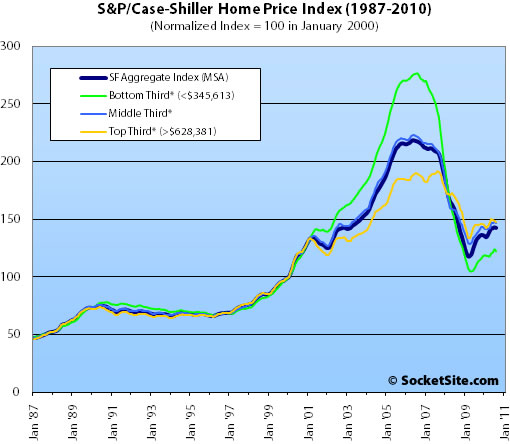
The bottom third (under $345,613 at the time of acquisition) fell 1.4% from July to August (up 10.3% YOY); the middle third fell 1.2% from July to August (up 6.3% YOY); and the top third (over $628,381 at the time of acquisition) fell 0.5% from July to August (up 2.1% YOY versus 2.8% in July).
According to the Index, single-family home values for the bottom third of the market in the San Francisco MSA returned to October 2000 levels having fallen 56% from a peak in August 2006, the middle third is back to just below April 2003 levels having fallen 34% from a peak in May 2006, and the top third is back to just below April 2004 levels having fallen 23% from a peak in August 2007.
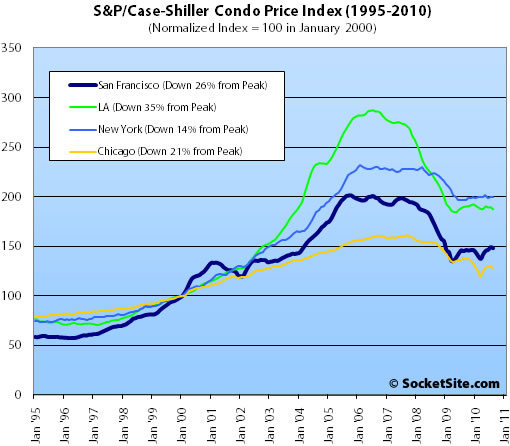
Condo values in the San Francisco MSA fell 0.5% from July ’10 to August ’10 and to a 2.0% gain on a year-over-year basis (down 26.4% from a high in December 2005).
Our standard SocketSite S&P/Case-Shiller footnote: The S&P/Case-Shiller home price indices include San Francisco, San Mateo, Marin, Contra Costa, and Alameda in the “San Francisco” index (i.e., greater MSA) and are imperfect in factoring out changes in property values due to improvements versus appreciation (although they try their best).
∙ Home Prices Increases Slow Down in August [Standard & Poor’s]
∙ July Case-Shiller: “San Francisco’s” Top Tier Slips For Second Month [SocketSite]
Even a dead cat will bounce, if you drop it from high enough.
The next few years are going to be interesting. The bounce we experienced starting in March 09 looks like it was a “buy at the dip” type of thing. I think we’ll see a series of oscillations in the next few years.
Ultimately prices will have to adjust with rent equivalent. A market cannot be upside down like this for ever (renting 50%+ cheaper than owning). My guess is that it will be a marginal decrease augmented by a higher inflation. In my newly minted and cautiously bull stance, I think these next 3 years will be a good time to cumulate some value RE assets. It’s much more interesting than 3 years ago.
I am putting my money where my mouth is: I am currently purchasing in the 94114.
yep, the bearishness is weighing me down. I’m organizing my real estate taxes right now, a dreadful task this year, supporting Heather Fong’s $265,000 retirement pay. Senior meter maids making 142k a year. Some of you folks don’t like prop 13, but without it the RE taxes would be confiscatory.
Prop 13 is just another example of shifting the burden to younger people.
We don’t need to be screwing all the recent buyers just so some hypothetical 90 year old can keep their property taxes at 0.05%.
I love how a CSI post gets a random comment about Prop 13 and state salaries.
try to keep it on topic unwarreanted
this drop in Case Shiller was completely expected. As some of us have said repeatedly: real time sales data dropped off a cliff when the FTHB credit expired
Case Shiller is a 3 month moving average, and reports the following month. Thus, we knew its data wouldn’t reflect the cessation of FTHB credit until now. we knew data would look ok until the October release, then the October release would be the first CS report to show some weakness, and that the weakness would continue until at least Jan 2011.
Today’s results were “in the bag” 3-4 months ago.
the only people who may be “surprised” by this result are the ones that throw out the 18% YOY gain number without realizing where it came from. (FWIW: I’ve never disputed the 18% YOY number, but I also know CS limitations).
===
(for the doubters-here was my post from 3 months ago when CS showed 18.3% YOY gains and 1.7% MOM gains):
My near term guess is not that much different from anybody else evaluating Case Shiller… we will continue to see strength until the October report due to the 3-4 month time lag. The October report will be the first that captures some of the post-homebuyer credit data and so that will be the first to show “pressure”… unfortunately the first report that will consist only of the post-homebuyer credit data isn’t until Jan 2011, which will show weakness.
I base this thought on the more real time data (New and Repeat Sales data, non seaseonally adjusted, mortgage purchase application data, etc) which all plummeted after the FTHB credits expired. Of course, many believe this plays little to no part in the SF market, but I disagree here.
Posted by: ex SF-er at July 27, 2010 10:31 AM
I am putting my money where my mouth is: I am currently purchasing in the 94114.
congrats on your new home LOL.
any chance we can get pics on socketsite to… uh… critique it? 🙂
FWIW: although I am more bearish on RE than many/most, I’ve also said numerous times how I’ve put tons of money into my home recently. around $70k last year(windows, doors, AC, siding, electrical), $7k this year (landscaping), and probably $100k next year (new kitchen, basement). not to mention a new furnace, new bedroom, new bathroom, sprinkler system all in the last 5 years.
will I get a return on that cash? probably not. i view it as consumption, not investment.
no reason that you can’t buy a home these days as consumption!
“Some of you folks don’t like prop 13, but without it the RE taxes would be confiscatory.”
Actually, under Prop 13, property taxes are arguably MORE confiscatory. Before Prop 13, property taxes were a local tax going to local causes and we could view local results. Now local governments are far more dependent on Sacramento’s whims.
“the only people who may be “surprised” by this result are the ones that throw out the 18% YOY gain number without realizing where it came from. (FWIW: I’ve never disputed the 18% YOY number, but I also know CS limitations).”
You mean the media and the legions who ignored the Morgan Stanley data on mix? 🙂
I haven’t done this for 6 months, so I thought it would be interesting to revisit the changing of the acquisition price tiers.
I’m wondering if the increase that the tiers have shown over the past few months is indicative of some of the more recently acquired inventory being re-sold.
Right now (October 2010) was when the Credit Suisse report from 2006 indicated we would begin to have a bunch of the 5-year interest only & option ARMs re-casting for SF(re-casting is different to re-setting). If these loans have not been refinanced then we may see the tiers continue to tick upwards as the properties that were financed in this manner back in 2005 return to the market.
Month…Upper 1/3….Lower 1/3
Sep-07..$860K……..$614K
Oct-07..$853K……..$605K
Nov-07..$834K……..$586K
Dec-07..$816K……..$566K
Jan-08..$794K……..$545K
Feb-08..$756K……..$513K
Mar-08..$734K……..$589K
Apr-08..$722K……..$474K
May-08..$722K……..$474K
Jun-08..$707K……..$447K
Jul-08..$696K……..$432K
Aug-08..$675K……..$410K
Sep-08..$648K……..$386K
Oct-08..$562K……..$321K
Nov-08..$592K……..$342K
Dec-08..$561K……..$321K
Jan-09..$527K……..$298K
Feb-09..$502K……..$281K
Mar-09..$482K……..$268K
Apr-09..$479K……..$265K
May-09..$486K……..$267K
Jun-09..$508K……..$276K
Jul-09..$533K……..$288K
Aug-09..$558K……..$300K
Sep-09..$577K……..$309K
Oct-09..$592K……..$318K
Nov-09..$601K……..$323K
Dec-09..$601K……..$326K
Jan-10..$593K……..$324K
Feb-10..$584K……..$321K
Mar-10..$589K……..$325K
Apr-10..$601K……..$330K
May-10..$611K……..$336K
Jun-10..$613K……..$338K
Jul-10..$622K……..$343K
Aug-10..$628K……..$346K
And, as our editors added last time I posted this:
“Remember, the price tiers are based on the initial acquisition cost for each sale pair, not the sale price of the properties today. In other words, a property that was purchased for $600,000 in 1998 and sold for $900,000 earlier this year would have fallen under the middle price tier in February.
Statements such as “The tiering is mostly irrelevant, given the fact that the top tier of ~$628k doesn’t really buy you much in SF” demonstrate a fundamental misunderstanding of the index.”
the only people who may be “surprised” by this result
Just to give some context, the July/August reversal (going from positive to negative) is unprecedented in the (short) history of the C/S SF Bay Area Index.
Quote of the day:
The statistics compiled by New America Media and the Stanford Center show that “as unique and specialized” as San Francisco’s economy is, it is nonetheless “subject to major natural and world trends,” Levy said.
http://www.baycitizen.org/economy/story/recession-worse-dot-com-bust-distress/
Ex SF-er, No pics or links, sorry. I do value my privacy or whatever PropertyShark and others have left of it. And it’s an ongoing deal (though pretty much assured).
But I can tell you that so far I haven’t had many big surprises. I put around 50% down. Mortgage + Property taxes + building Insurance are less than 80% of rent value, my own benchmark. Not a bad deal I think. Seller has no mortgage and therefore no real hard limit like many many underwater guys I have seen in SF. He chose the safe offer, if not at the price he probably expected. 20% under his original price. 30% under the delusional price he couldn’t get 2 years ago.
Another place I was following closely is owned by a mid-level manager at one of the big techs in SF, an unfortunate bubble-topper (2007 in prime SF). He was asking mortgage + realtor commission, losing only his downpayment. Of course he got no offer… He gave up last month and went the accidental landlord route, opting for steady red ink (1500-2000/month) instead of the strategic default.
Anyway, I am stoked.
lol must be lying because nobody has that kind of cash to put down, and if they did they would keep it and lock in a low interest rate with an FHA loan at 97.5% down plus 3% in credits. plus, everyone in SF is underwater and mortgaged up to their ears, so the seller is imaginary too.
right tipster?
now if only we can get some realtors on here swearing that lol’s story is true which will further prove that it isn’t.
I agree with hangemhi. Who would put 50% down in this market when you can use other people’s (bank) money. Not buying it.If you are purchasing to rent out, it’s not a very good deal if you need to put 50% down to cash flow.
“Santa Clara County, which contains Silicon Valley, experienced 8.7 percent wage growth from 2009 to 2010. San Francisco County had 5.4 percent wage growth. These two counties were third and fifth on the list ranking areas by wage growth.”
http://economix.blogs.nytimes.com/2010/10/26/the-information-economy-powers-wage-increases/
Though, oddly enough San Mateo county experienced wages dropping by 17.7 percent.
Though perhaps this just means that the job losses have been concentrated amongst the lower income tiers.
Nope, I am not buying to rent out. At least not for now. I am always using rent vs buy to figure out fair pricing. This deal pencils out whether I put 20% or 50% down. 50% is within my comfort zone and allows me to save tons in interest while paying less than a similar rental, therefore why not doing it? I will sleep better at night. In my own home.
I also know about the risks of the ongoing crash, first loss position and all. But I have a sufficient margin of error. And if prices still go down, I have some dry powder left to get other deals and still a lot of leverage with the bank in terms of debt-to-income ratio. I was never a perma-bear despite what fluj and a few other perma-bulls thought.
Though perhaps this just means that the job losses have been concentrated amongst the lower income tiers.
Either that or people became unemployed in 2008, stuck around looking in 2009, and then, tired of being unemployed in a high price area, left, causing the per capita income to rise.
I think that you have to put statistics, touted by a very liberal leaning newspaper and released by a very liberal administration just before an election in which the liberals are probably going to get hit pretty hard, through a bit of a BS filter.
It amazes me that certain people just can’t understand that linking to any given article in a quote unquote respectable publication doesn’t “prove” one’s point.
Are the NY Times, the WSJ, and the like (whether left or right leaning) free of editorial bias and influence? And I’m not referring to the oped page.
Is not a major draw of owning an instrument of mass media the outsize political influence that comes with the ability to manipulate how news and information are disseminated?
Just because a reporter says so, does that make things so? The way some people use random articles to prove some forgotten point, one would get the impression that reporters are infallible. Or that they are impervious to bias, wittingly or not. Or that the information that sources feed them is absolutely always 100% accurate.
Just because an economics professor or financial columnist (for examples) says so, does that make things so? How many “world class” economists or “respectable periodical” financial columnists were calling the housing bubble a housing bubble in real time? There are several posters at SS who would be considered very “amateur” economists who did a far superior job of analyzing the bubble economy in real time.
Just because some statistic is thrown out in an article, does that mean that the statistic is accurate? Mostly, one would never know for sure as most all news articles are digested then forgotten, but occasionally an article appears that “corrects” in some way or another some misleading statistic.
Take for example this article in yesterday’s NYTimes….
http://www.nytimes.com/2010/10/26/business/26tarp.html?_r=1&ref=todayspaper
Now I link to this article not to prove any opinion I might have about AIG or TARP or the like but rather to show the foolishness and fallacy of declaring that some random article proves one’s point about anything, much less a super politically charged topic like TARP.
For example, if at Socketsite I had linked to an article in the same “respected” periodical a few weeks prior that claimed TARP was a success and cited said article as unequivocal proof that I was right about TARP, well I would be feeling pretty stupid right about now after reading how the “United States Treasury concealed $40 billion in likely taxpayer losses”.
Now, maybe some people may try to change the focus of the discussion by claiming that I’m “attacking the messenger”. Actually it seems clear that I have been attacking the fallacious manner in which some people “prove” their assertions. Truth be told, it has been numerous others who have felt the call to “attack” certain messengers as sanctimonious and hypocritical.
“I think that you have to put statistics, touted by a very liberal leaning newspaper and released by a very liberal administration”
This doesn’t make much sense. Who cares if the newspaper is liberal or not if they’re printing BLS statistics consistently? As for the “release” of the numbers, the BLS goes out of its way to avoid having numbers massaged, for one thing. As one example, the timing of the release is set well in advance to avoid these issues.
Who cares? You would have to be very, very stupid not to look at the bias of a newspaper when reading their articles.
Statistics do not exist in a void. They requires some interpretation. As noted, it could be that wages are rising very rapidly, or it could be that a couple of thousand mobile unemployed people moved out of the area. $0 kind of hits the averages pretty hard.
In any event, you need to look at the bias and then you might dig deeper and even draw an opposite conclusion from the one drawn.
Sorry, tipster, but there’s no bias here on the part of the NYT. You’re just making up conspiracy theories here. They relayed statistics without interpretation:
http://www.bls.gov/news.release/cewqtr.t01.htm
And it wasn’t even the NYT, but a professor at Harvard who is blogging for the NYT. This is Q1 data being released in October.
What would be important is if BLS changed their method of data collection in between Q1 of this year and Q4 of 2009. Do you have any evidence of that?
This listing looks to be among the first resales of the knifecatchers.
Purchased in 2006 for 1.41 it was sold to knifecatcher #1 for 1.279 in Feb ’09. It’s been listed at 1.225 for over a month and just dropped to 1.175.
So knifecatcher #1, thinking he had bought it for 130K less than the previous owner now has it listed for 104K less than he paid. One of the two remodeled, so someone lost even more.
If you look at case schiller, Feb 09 was “the bottom!” Ha ha, tell that to this seller when he walks away from more than $150K, having purchased at “the bottom”.
http://www.redfin.com/CA/San-Francisco/1177-Filbert-St-94109/home/1152768
An unsourced comment from an anonymous commenter on a blog has such a greater weight than a fact checked article in a major newspaper? This is a strange way to assign credibility, but if you are just looking for evidence to support your bias, I guess this is the easiest way to do it.
http://www.bloomberg.com/news/2010-10-20/bailout-of-wall-street-returns-8-2-profit-to-taxpayers-beating-treasuries.html
The bank bailout is an important question and a debate that has raged for years both on Socketsite and in the general community: was the TARP a good idea and is it a rip-off to the taxpayers or not?
It is certainly possible to debate that point without personal attacks and I commend you for at least trying.
Oh NVJ.
I can’t believe that you would try to point to tarp returns. Those returns only exist because the losses were transferred to Fannie and Freddie. When they need their $400B bailout remember that part of that bailout is the “profits” that we got from tarp.
There is a certain truth to what you say diemos, but given the magnitude of the problem, if the total cost to the taxpayers in only $400B we should count ourselves lucky. The S&L bailout cost $160B in 1995 dollars.
At the time most of the gloom and doomers were pounding the table that TARP was certain to be a failure. It turned out better than most expected.
“An unsourced comment from an anonymous commenter on a blog has such a greater weight than a fact checked article in a major newspaper? This is a strange way to assign credibility, but if you are just looking for evidence to support your bias, I guess this is the easiest way to do it.”
Who makes this argument? The imaginary strawmen dancing around in your head? What a pathetic attempt to deflect attention from the fact that you have no defense for the actual point of discussion. Which is….
“It amazes me that certain people just can’t understand that linking to any given article in a quote unquote respectable publication doesn’t “prove” one’s point.”
——————————
Back to your absurd strawman contention.
Nowhere in my prior post does it even insinuate that I think that “(a)n unsourced comment from an anonymous commenter on a blog” should be used as ABSOLUTE PROOF for any given argument.
Nowhere in my prior post do I argue that “(a)n unsourced comment from an anonymous commenter on a blog” should be “assigned more credibility” than any other opinion, solely as a consequence of being “(a)n unsourced comment from an anonymous commenter on a blog”.
As a result of your total lack of defense for the actual point, it seems you are trying to change the focus of the discussion by ineptly manipulating this very tangential statement from my prior post…
…”There are several posters at SS who would be considered very “amateur” economists who did a far superior job of analyzing the bubble economy in real time.”
Now the above statement does not argue that these “amateur” economists have more or less INHERENT credibility than, as you describe it, “fact checked article(s) in a major newspaper”.
Rather (and this is very clear in the context of the prior post), it was used to illustrate the point that in the mother of all financial/housing bubbles, the huge majority of so called experts from these “major newspapers” (and I won’t even go to academia) got it so horribly wrong in real time for whatever reasons.
The point was not to elevate the status of anonymous blog posters, rather it was to point out the foolishness of UNCRITICALLY assuming that people and their reporting and opinions are “more” correct (or frankly even correct at all) just because they are employed by a “major newspaper”. On this issue, you seem awfully naive or maybe you’re just willfully ignorant.
———————–
In the end, it is interesting that you state the following…
“but if you are just looking for evidence to support your bias, I guess this is the easiest way to do it.”
…because this perfectly describes what you do when you link indiscriminately and uncritically to your infallible “fact checked articles”.
Think for yourself.
Stop looking for gurus, “fact checked” articles, and other authority figures to give you “the answers”.
Assume when it comes to economics that everyone is lying to you. That everything you read in the MSM is designed by the people paying for it to get you to hold still and look the other way while your pocket is being picked.
Question. Analyze. Think. Remember that only your mother loves you and that’s only if there isn’t a significant amount of money on the table.
Read the fine print. Ask yourself, “Que bono?”, Who benefits?
Speaking of strawmen, who stated that fact checked articles are “infallible”? Not anyone on Socketsite, that is for certain. And who stated that providing evidence of ones position is “proof”?
But you are welcome to play your ontological games with yourself.
Most “experts,” or certainly the economic experts that I bother to give credence to, suggested that a housing and credit bubble was in the making as far back as 2003. I could give you the link to articles in The Economist article but I fear it will put you into a frothing rage about how evidence is not proof, or some other such nonsense position of yours. Krugman was talking about the possibility of a housing bubble in 2002 and warning about it happening in 2005. Thoma was warning of it in 2004, DeLong in 2005.
So there were many economists, you know real economists, the kind that have degrees and actual professional reputations and the like, who were warning us of the housing bubble a long time ago. It is not my fault if you were paying attention to the wrong sources and were caught unawares. But anyone who has bothered to keep track over the years of who has been right and who has been just ideologically driven and wrong as often as right, would have been paying attention to the correct experts.
See that’s how you prove your point, with a preponderance of evidence. And I can even give citations and all. But mostly you are just going to have to take my word for the things I say, I don’t state that things are true without evidence and I don’t have the time or inclination to chase down every point. If you don’t find my contribution worthwhile you are free to ignore it.
LOL, because if Robert Shiller isn’t a guru then neither is Ram Dass.
Here are the preliminary October sales numbers (maybe a dozen or so late entries will probably trickle in):
2010
SFR 168
Condo 147
2009
SFR 234
Condo 221
So down about 30% or a bit less than that once the final figures are tallied. An enormous drop, and declines in sales go together with, and precede, declines in prices. Look for CSI to continue to fall.