As we wrote a year ago with respect to the Perata Mortgage Relief Bill:
Unfortunately, we doubt the new law will have any meaningful impact on foreclosure rates throughout California other than to delay the inevitable. The only real impact we expect: making properties that have been foreclosed upon more palatable to the public.
As we wrote this past July:
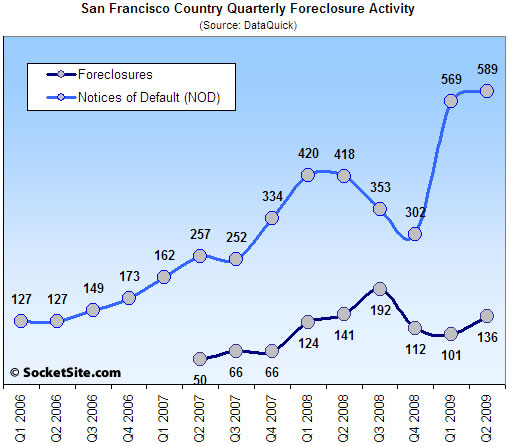
Expect San Francisco foreclosures to rise dramatically over the next few of quarters as moratorium delayed NODs work their way through the system.
And the Chronicle’s headline today: “Foreclosure-mediation laws not much help.”
∙ Govenor Schwarzenegger Signs The Perata Mortgage Relief Bill [SocketSite]
∙ Actual San Francisco Foreclosures Up 34.7% QOQ (Down 3.5% YOY) [SocketSite]
∙ Foreclosure-mediation laws not much help [SFGate]
Has anyone notified the Animal Shelter?
http://blogs.wsj.com/developments/2009/09/22/the-furry-side-of-foreclosure/
Looks like we’ve definitly hit bottom. I like it.
Interesting story! Smart man that Mr. Card!
Nice chart too, but 2009/Q2 foreclosures are about same as 2008/Q2. Does anyone want to predict the foreclosures in Q3 and Q4?
whats “San Francisco Country”?
Doesn’t exactly look like a bottom to me, that chart is trending in a vertical fashion.
What all the politicians spout about doesn’t matter much when you see a chart like this.
Foreclosures in 2Q2009 benefited nationally from the pause by lenders who awaited any change in a new administration’s policies.
If you want Q3 & Q4 guess, I’d put them both above the 200 mark. Call it 222 and 237, respectively, mainly to pay homage to Karen Valentine and Jack Nicholson.
NOD’s are up 41% year-on-year, and in Q2 ’08 we were already well into the “crisis”. I guess we couldn’t expect the boiling frogs to stay in the pot as long as we thought.
Hee hee, the Room 222 reference cracked me up (I’m just barely old enough to remember that show) — and that’s a good guess for Q3 foreclosure sales. I’m guessing Q3 NODs will be at about 750. Both will be higher in Q4. I’ve heard banks are loosening up a bit on permitting short sales, so that could drive these foreclosure numbers down a bit, but that would be offset by a rise in short sales which have roughly the same impact.
I’d say we’re heading into a nuclear winter. Here comes the ruthless defaulters, and well, those who just feel plain trapped.
There was a huge jump in NODs between q4 08 and q1 09 (about 66%).
Will there be a similar increase in foreclosures next quarter given the lag in the sequence or can the banks drag this out indefinitely…?
I’d be interested to see these same numbers for San Francisco from the 2000-2001 tech bust period. How much does the economic impact of unemployment alone contribute to NODs and foreclosures; vs. mortgage re-sets attributable to loose lending practices?
2000/2001 period won’t reveal any insight, IMHO, because that’s when the bubble started its parabolic ramp, bolstered as it irresponsibly was by an evil shriveled lizard named Green$pan (may death come to him and silence forever his worthless piehole). Few needed to face foreclosure during that period – they only needed to place their home on the market and pocket any available gain. Further, the dot-bubble tech-set were 20-something renters – the frenetic activity in SF during that period as I remember it was seeing 40 people show up for a studio rental open house, followed by bribes-to-lease.
since everyone here seems to love the idea of the googlionaires fading away
http://online.wsj.com/article/SB125381978756438557.html
perhaps this is behind the development of ‘alpha’ in the above market pricing of some recent sales
Never understood the logic of buying a $10,000 gallon of milk just becuause I have the capacity to do so. In any case the googlionaires phenomenon (sp) won’t last too long. Other, more powerful interests will ensure that subsequent google employees will eventualy become just another Joe Shmoe commuting to work just like the rest of us (i.e. see all dashed hopes of early retirement in the biotech industry).