As a reader wrote about 1005 Duncan two months ago:
We looked at this house in ’07 and seriously considered putting in a bid, but the agents told us that there were 7 other interested parties and we just weren’t interested in putting up a fight….They allegedly got six bids on the offer date, but they declined to sell because they were looking for something over asking [of $1,238,000 at the time].
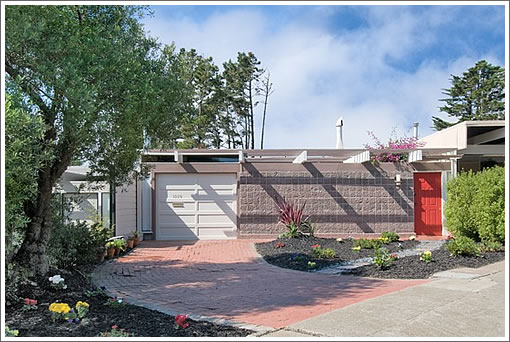
Renovated and returned to the market in 2008 asking $1,239,000, and then relisted in 2009 for $1,150,000, the sale of 1005 Duncan closed escrow today with a reported contract price of $1,200,000. That’s an official 4% “over asking” and “60” days on the market.
Mission accomplished?
∙ Duncan Chic (No, Not Sheik): An Eichler Up In Diamond Heights [SocketSite]
∙ Not Exactly A Slam Duncan: 1005 Duncan Returns (This Time Reduced) [SocketSite]
it sold. that’s a mission accomplished 😉
And sold for quite a bit more than the any of the values assigned by SS readers, including spencer (999,998), LMRiM (650-750k), geekgirl (800k), dch (8-900k), mysteryrealtory (999k).
[Editor’s Note: We’re having trouble locating your estimate of $1.2M. And as always, don’t bother to criticize others unless you’re on the record yourself.]
Minimal loss in value (if any) during the worst real estate bust since the great depression, in the middle of a severe recession– definitely mission accomplished.
Asking $1,238,000 in October of 2007 the agents for 1005 Duncan were unable to find a buyer. So they renovated (Eichler purists look away). And raised the price to $1,275,000.
Back on the market today once again as “new.” And now asking $1,150,000.
Which means it sold under 2007 asking and most important after renovation.
Still a nice price. Good job on the sale!
I’d say it’s mission accomplished. Not too shabby all things considered. I hope the new owners enjoy their new digs and that backyard.
No criticism at all. Just reporting the facts. I am sure the posters stand fully behind their estimates.
Re sanfrantim:
I did say that “we can’t see paying more then $800k for it” referring to myself and my husband. I had no opinion on what someone else might pay for it. 😉
That said, if I recall correctly, it is zoned RH2 so I wonder if it was bought by someone planning to add an additional unit.
Exactly, geekgrrl. I was not being snarky at all (as I tried to point out above), and I was careful to say that the numbers given before were “values” and not “predictions” of what the house would sell for. If you feel I have misrepresented you, I’m truly sorry.
It was bought by some friends who really wanted a flat yard for the dog and a cool house to go with their mid-century funiture.
I found LMRiMs comment here
Not that I think it’s a valid comparison (it’s not), but this is another SF property that has failed to keep up with the S&P (S&P started 1989 at 275, it’s now 831) even if it sells here at $1.15M. I guess it’s not primo.
interesting.
Of ocurse, givne it sold for more than 1.15, and the S&P has fallen below 831, I more than kept up with the S&P.
Even if it didn’t, with the effect of leverage the investment (although not being aware of what the original downpayment was) returns will be far far in excess of what could be obtained from stock market indices.
It seems that bears here are quick to point out the effect of leverage on the way down, but then not realise its benefits when profits are made on sales.
But the new owner could be in trouble if LMRiMs estimates of value come true – a further fall of 45% plus closing costs are expected!!
Of course, I can trade stocks for $7 a pop while the seller paid $60K to unload this place (assuming 5% commission), to net $1.14 million. So below the $1.15MM thrown out by LMRiM.
And the cost of maintaining a position in the S&P is negligible. Was there no maintenance attached with ownership here? I’m sure that the renovation was free, right, pep squad?
But these are trying times, so I can sympathize with the need to shine a spotlight on any property trade that isn’t a total disaster for the sellers. After all, it’s real estate: why let the facts get in the way of a good story?
If the place languished for 60 days, it would seem obvious they didn´t have any close offers to the asking price. My questions is, why pay more than the asking price. Lowballing is the keyword in this kind of market.
I could see offering or bidding up the property when it is first listed but after 60 long days… Or, is the listed price just the bait. The property really isn´t for sale at that price only a higher one.
REpornaddict,
RE is not an investment but it sure is sold as one.
On one hand the S&P does not provide you with a roof and your kids will not have fond memories of it. It is very liquid though.
On the other hand the guy buying his S&P did not have to pay taxes or paint the place or unclog the pipes or do the landscaping or many many other holding expenses. Overall, the cost of owning a place, debt-free, is at least 2% of the value per year.
2 very different mediums that shouldn’t be compared.
Real estate is not an investment?
How about AIG or Citigroup stock? OOPS!
For me, my home will always have more value than that.
LMRiM is a big boy and he can explain himself, but I think he was making the following point. This buyer bought in 1989 at a very good time (not the absolute best — prices were probably lower 5 years later) before two remarkable asset bubbles drove RE prices skyward. And he sold at a very good time (again, not the absolute best — that would have been about 18 months ago). Yet he still only came out about even with the S&P, even after an epic stock market crash, and even if you discount the other costs noted above (leverage is pretty irrelevant after 20 years).
This notion of SF real estate as some guaranteed fantastic investment is a lie. It is a place to live and should be priced accordingly. It’s getting there . . .
An accountant once told me that if people had really tracked what they spent on their houses (he saw the expenditures: remodels, repairs, maintenance, taxes, new carpets, drapes, paint, insurance, etc.), almost none of them would find they actually made money, but nearly all of them believed they had.
Where are all these people investing in the S&P 500 going to get their loans at sub 6% interest to turn around and invest in the stock market?
If you’re a millionaire, then it may be a more valid comparison, but for the working person, a mortgage is going to be the only real way to gain that kind of leverage.
I’m more than willing to admit, up front, that I may be missing something obvious.
Regarding: “Where are all these people investing in the S&P 500 going to get their loans at sub 6% interest to turn around and invest in the stock market? …. For the working person, a mortgage is going to be the only real way to gain that kind of leverage. I’m more than willing to admit, up front, that I may be missing something obvious.”
The point I think you’re missing is that leverage works in both directions – i.e., in a rising market, you can make a lot more than your down payment, and in a falling market, you can lose a lot more as well (as thousands of working people in the East Bay, Stockton, Sacramento, etc., have found out in the last 12 months to their detriment).
No inconsistency here, but thanks sanfrantim for being careful with “values” as opposed to “predictions” (sometimes I’ll make a “prediction” as to selling price, but here I was just opining on “fair value” in a very rough way – hence the wide spread in value range).
I stand by my fair value estimate of $650-750K. That’s what I think is the “intrinsic value” of the property. 1005 Duncan selling for $1.2M demonstrates that it is still a very good time to sell SF real estate, even if it is not as good as it was a year or two ago: the market price being paid by buyers is still far above intrinsic value. If it were possible efficiently to short the house, I would, but unfortunately real estate is not an efficient market, and pricing is dependent on the marginal purchaser.
I’ll try to be more clear in any future discussions, because I recognize that “fair value” sounds very much like the common FMV concept (fair market value) used in the industry to approximate appropriate selling prices. (“Fair value” is a very common valuation term in securities and most other investment markets.) I’ll go to “intrinsic value” in the future to avoid any confusion.
Keeping this discussion in mind, the next time an “apple” closes I’ll try to illustrate the way most people doing asset valuation use concepts of intrinsic value. It’s more a measure of risk, than a predictive tool.
BTW, my S&P comment was only to counter an idea that was going around on SS very vehemently back then (mostly by poster “paco”) that over any period SF real estate has done much “better” than the S&P. About leverage, having traded a leveraged account at a major hedge fund, I can assure you, Repornaddict, that I comprehend leverage on the way up (and the way down) with a visceral understanding that very few people get to experience 😉
Brahma,
You are indeed missing something obvious.
With an investment in the S&P 500 your maximum exposure is the value of your principal. So worse case scenario (and if you are invested in an index fund this scenario would have to be a monumental catastrophe probably involving the collapse of civilization as we know it) you lose all of your investment.
In a home, you are leveraged, so if there is any decline in value your investment is first in line to go. So between transaction costs and carrying costs, even a 5% decline can wipe out a 20% down payment. And if the property continues to decline in value, your losses can exceed 100% of your principal.
In a housing market that is generally perceived as being on the downswing for the forseeable future, this is a noteworthy point. Access to leverage is a double edged sword.
The key to buying right now is to buy something that you are prepared to live in for a LONG time. I have to say I think this house is a pretty good candidate in that regard. It’s certainly beautiful, and I think will provide the buyer with many years of happiness. My congratulations to them, and congratulations to the seller.
Do you people EVER get bored with yourselves and this pointless argument?
Because you really should.
@LMRiM
As I understand it, Fair Value/intrinsic value for securities is based on discounted earnings using a more-or-less scientifically estimated IRR and a guesstimate for the terminal cap rate. Is there a methodology behind your fair value/ intrinsic value estimates for residential RE? Is it based on cap rate and/or gross rent multiplier?
Just interested in your thought process.
By the way, the terminology “Fair Market Value” is considered somewhat outdated in the real estate industry. Most people just talk about “Market Value”.
I’m getting there, amused.
But to answer Brahma’s question, you can also lever equities (although I never have or would – way too risky). I think margin limits are still 50% today, with rates below 6% if the book is big enough. Not quite the 12:1 gearing that LMRiM probably operated with, though.
As the listing agent for this property, I’d like to report that in addition to the over asking winning offer, we had 2 back-up offers, and both were significantly over the $1,150,000 asking price. In total, we received 5 offers on this property. It was a pleasure to market and sell. The new owners and their poochie will be very happy there.
Thanks LMRiM – I didn;t suggest that your quote of 650-700k was a predicted selling price. and i didn;t suggest you didn’t understand leverage – but it’s often forgotten more on the way up. this investor presumably used leverage to make a much bigger gain than he would have been able to on the S&P, say.
but i have to ask – is the fair value where you think the priceof SF real estate is heading? because that would imply a fall in this property of around a further 40-45% – on top of where the market has already fallen – 10-15% maybe?
that’s a total fall from peak prices of 50-60%.
is this your prediction for good parts of San Francisco like this? If not, what will keep the prices of houses above their fair value?
and if prices don’t fall to their fair value then there doesn’t seem to me much point in quoting it.
the math is not additive, in the example above the high point would be 46-55 and not 50-60. no big deal usually, but 55/60 is an 8 point spread and significant when talking leverage.
@ JPS listing agent
“As the listing agent for this property, I’d like to report that in addition to the over asking winning offer,” bla bla bla…..
And you still believe this is truly an “over asking winning offer”! LOL
Viewlover you are right of course… apologies.
but I would still be interested in LMRiMs answer to my earlier question, with of course the fall from peak in question being 46-55% in good areas of SF.
slightly lower than I had earlier stated, but still a far bigger fall than most on the site have predicted I think.
no apologies necessary, normally would’nt point it out.
Not sure about 50% drops, but this place did not see it.
SausalitoRes & REpornaddict,
About valuation methodology, I think GRM-type analysis is more appropriate for residential real estate than pure DCF-type analysis. In any event, “terminal value” in the residential real estate context is reflected in the GRM. Obviously, GRM analysis is not appropriate for very special or unique properties, but it probably covers 95% of what’s out there in any market (even SF).
In any GRM analaysis, it’s important to use some conecpt of normalized equivalent rent (similar to how people in securities analsys try to normalize earnings). This eliminates anomalous rental conditions, such as 1996-2002, and perhaps 2007-08, in SF, when marginal rents were clearly inflated beyond equilibrium because of bubble effects (dotcom in the 90s, and the temporary effects of the first stage of housing bubble implosion in 07 and 08).
I also adjust my rough multiples to take account of where we are in the credit cycle (beginning to pass from credit inflation to credit deflation, which will tend to lower multiples going forward) and where we are in the price inflation situation (mild deflation for a while, then increased generalized price inflation combined with wage compression). SF also has the anomaly of prop 13, whhich imo had the tendency to increase equilibrium GRM ratios over the past 20 years or so, but which will now tend to decrease GRM as “legacy supply” is turned over (people who have been enjoying very low taxes will begin to judge in a declining price environment that there is a larger cost to retaining the houses than previously).
Bottom line, for intrinsic value I tend to think in GRM terms of a range from 5 (for the absolute least desirable properties such as 1/1s in dengerous hoods) to 20 (for desirable, large SFRs in the best neighborhoods). I also try to check my intuitions of value against a baseline of inflation adjusted mid-90s prices in SF, but this is very rough because of the huge distortions that have been present in the SF market (which has been in an almost continuous bubble/bubble-aftermath cycle for a generation).
REpornaddict, about whether fair value numbers are predictions, not exactly. The intrinsic value of a property will change of course, as the economy evolves, neighborhoods change, price/wage inflation occurs, etc. That said, my gut feel is that we will see approximately 40% drops on average in nominal SF prices, with of course some nabes/types of property doing much worse than others. Obviously, some properties/nabes are already down much more than 30% from absolute peak, but some are only down 5-10% (very few I’d argue). In any event, I wouldn’t expect the absolute nominal bottom of prices until 4 or 5 years from now (at the earliest), but I do sort of think that most of the nominal drop will be over by the end of 2010.
Hope that helps!
Rereading that, I should point out that the 40% drops on average I was talking about are from peak levels, not from today, and there are obviously some very difficult measurement issues hen trying to figure out just where prices are at any given moment.
“and there are obviously some very difficult measurement issues hen trying to figure out just where prices are at any given moment.”
and where “the peak” was.
Absolutely, diemos.
But when you see examples of madness like this one, which is off (at least) 41% from “peak” (making the assumption that the $630K mid-2006 price was the peak), you can see that something very wrong happened in SF valuation land:
http://www.redfin.com/CA/San-Francisco/262-Minerva-St-94112/home/1465061
No offense LMRiM, but Oceanview is not “real SF”; I mean, or cryin’ out loud, the REO ratio is 4:1. That’s right, there are 4 homes in some state of foreclosure (NOD, NOT, or REO) for every one that is for sale.
In Diamond Heights, there are two NODs (seconds that will probably get cured) and a ~600 sq.ft. 1bedroom about to be auctioned off. Not exactly, what were anonn’s word, a REO capitulation tide. Guess we’ll have to rely on prospective homeowners doing the price/rent calculations. While I’m expecting some areas of “real SF” to get hit by REO capitulation as more ARMs recast, I’m guessing others will only succumb if people crunch the numbers or disabuse themselves of the notion that SF is the only game in town… Much different than “hitting the wall at 100mph” which has characterized the downturn in other regions.
Re: sanfrantim
No need to apologize. No misrepresentation, offense or snarkiness taken. 🙂
In case anyone cares, when my husband and I determine what we think a property is worth, part of our equation is how much we’ll have to spend to NOT live in a house while repairs and renovations are made, in addition to the cost of the repairs and renovations themselves.
I’m sure the seller doesn’t see that as relevant or apart of the cost of their house but we do.
Lmrim- i’m afraid that your attempts to apply quant type stock market analyses to RE, while interesting, are missing the mark in some critical ways. simply stated, you’re spending alot of time parsing out specific trees, while missing where the forest is.
firstly, most SF buyers buy in SF because they choose to live in this city. it’s a destination, not a default selection. a bwm 7 series buyer can easily choose a more affordable car, but they choose to spend more on a higher end car. having said that, nobody wants to be ripped off, nor overpay for something. RE has alot of intangible and emptipnal components to it, and many people with means want to buy and live in SF.
Now i know your story of renting for a fraction in marin, getting many of the same benefits as homeowners there, etc., etc. that’s great and it works for you (and apparently your wife too, for i know many a wifes who would be busting their hubbies big time w/the same proposal long term:) but the thing you need to think about is simply, ‘okay, how many people out there think like me. let’s rent our SFH, it’s a better deal.’ sorry charlie, not many. think about it. for someone who is doing pretty well financially, they will choose to own, even if it costs them more. i know all about how they’re wasting money, etc. but *reality* is that most upper-mid bay area peeps want to own. good luck changing that sentiment.
that single psychometric throws your whole 5-20 GRM estimates off. first off, there are generally no 5 grm properties in the bay area, i doubt even in cali. you gotta go to detroit and other rust belt post industrial wastelands for those kinda #’s. even 20 is much too low for SFH. 20 gets close to some mid level condos and tic’s in SF, but SFH are much higher.
also, your normailzed rent analysis is off. yes they went down from dot.com, and then reached that level again in 08, but they are only down 5-10% from 08 today. and the tie in to desire to own is loose at best (and certainly not a direct tie in), for reasons i mentioned above.
and your prop 13 analysis seems to be redundant/circular reasoning. i.e. if somebody really believes that SF hosuing is going to drop -40% over the next 5+ years, prop 13 is not an asset to them a priori. for those who do not believe this, prop 13 has the same benefit it always had, and is usually indirectly applied in most people’s mind, as it exists and will probably not go away anytime soon.
i think that applying stock market analysis, while interesting, can be deceptive and potentially misleading when evaluating RE in its totality. namely, this analysis is unable to account for critical psychometrics (i.e. desireablity of homeownership, influence of upper mid income levels, meaning of ‘home’) nor for the the uniqueness of each property and scenario. these are critical factors, potentially overshadowing the quant analysis you present.
p.s. i’m not trying to rip you, just trying to widen the discussion metrics. feel free to elaborate on my comments.
…this analysis is unable to account for critical psychometrics…
Personally, I feel that the RE industry has for a long time relied way too heavily on those psychometrics, or at least put far more value in them than can be justified. I’m really glad to see someone attempting to put some analysis into the discussion.
All the psychometric awesomeness in the world can’t square the skewed relationships between wages, rents, and asking prices in the Bay Area.
Well, we’ll see hipster. You’re right that 5 GRM is not atainable now in almost anyplace in CA I’d guess, but GRMs like that (for instrinsically lowest desirability proprties/nabes) have certainly been available before in different time periods and in different places. In undesirable parts of NYC, for instance, GRMs for smaller 4-6 unit apartment buildings got down as low as 2-4 as recently as the early 1990s. I’m only using 5-20 GRM as a range for intrinsic valuation, and on that metric, I wouldn’t touch Cali property yet. Of course, for someone like you who is in this market everyday, you can spot opportunities – it’s your business.
About Prop 13 – watch how this unfolds and remember these talks 10 years from now. I’ll bet almost anything (at least a burrito ;)) that in 10 years analysts will be talking about the “prop 13 effect” as one reason why SF property values will have done so poorly over the prior 10 years (on a relative basis). Over the past generation, Prop 13 imo has created its own cumulative valuation bubble in resource-constricted places like SF, some of the older suburbs where desirability is high, etc., which will need to wash out. Distortions always do.
About “middle class” Bay Area types not wanting to rent, I’ve got an anecdote for you. We’re very good friends (for years) with a family who owns a house in Forest Hill Extension. In September 2007, at one of their kids’ birthday parties, the parents all had a talk about property values – they wanted to move to Mill Valley or Tiburon at some point in the future, and had explored selling their house with a very well known realtor (probably the most recognizable of the two or three out there who seem to get 80% of the business), who pegged the right selling price at $1.25M. I urged them to sell it right then (they had bought for about $500K in 97, and had put about $100K into upgrades/landscaping over the years), rent and then buy a place in Tiburon/MV after the “coming wipeout”. They laughed at me a little (but at least on a ski trip in late March 2008 they listened to me and then divested their entire 401(k) stock/IRA portfolio at Dow around 12K).
Very long story short, they recently refi’d and the appraisal came in at $950K. The realtor they originally spoke with is now telling them they “might” get $950K, but that if they wanted to be sure they needed to update the bathrooms and do some other cosmetic things that would cost ~20K.
The punchline? Literally this weekend they were up visiting us. They had just signed a lease on a 2/2 townhouse in Tiburon. Smaller than what we have (and btw their house in FHE was smaller and not as nice as the one we rented in Monterey Heights). They are going to keep the FHE house and try to rent it out “until the prices come back”. So, in short, I do think that middle class people in the Bay Area are going to rent – the ratios are just too out of whack. The entire cost of rent (about $25K) is going to be less than the cost of private school for one kid – and tey’ve got two, both of whom are now going to be paid for by the recent purchasers in Tiburon who paid these crazy prices (and consequently pay these lunatic property taxes). Now, if only they would wise up and dump that place in SF before it falls all the way down to their adjusted 97 price……
i recommend you guys look at richard florida’s writings (author of the creative class), as it relates to cities, and by extension, real estate: http://creativeclass.com/whos_your_city/overview/
remember back in 1999, when everyone thought the internet was going to create a level playing field wrt location- everyone could telecommute, and hence pricy real estate was going to die. NYT editorialist (and big time gabber) thomas freedman even declared that the world was flat (title of his book.) well, he was dead wrong! if anything, the internet has resulted in certain metropolitan areas becomming big winners, and others rust belts.
even with the current recession, the leading regions with the best companies, jobs, educational institutions, and cultural/recreational ammenities are attracting the smartest workforce (case in point- imagine how exciting this blog would be if it were based out of waco TX.) these areas will continue to attract many smart and financially successful people. and as the economy continues to globalize, these areas will become even more influential.
given this socio-economic condition, i don’t see why SF RE is going to drastically ‘reset.’ i don’t think all new technology and other innovative firms are planning to relocate to modeso or reno. nor will innovative small businesses that creative locales tend to sprout. clearly traditional blue collar jobs will not be a growth trend, but specialized manufacturing, and artisanal production probably will rise here. and numerous specialized services as well.
all these factors keep real estate prices at a premium. and have kept SF RE at a premium over the last 20+ years. so if SF had been ‘overpriced’ for 20+ years, why will people all of a sudden realize this now? and will that also be the case for every other high priced advanced region in the country? the world?
something else to consider. every region and most cities, have their high priced areas. because SF is so small and landlocked (compared to other well known cities) its as if the whole city is high priced. and it’s supported by a huge industrial base, silicon valley. (and please, don’t tell me how the valley will be dead in this recession. if the valley will be ‘dead’, what will every other region in the usa look like? deep freeze dead?)
45 yo hipster,
Even if SF unwinds quite a bit, it will still have premium prices. Your reasoning justifies SF costing more than Waco, but doesn’t explain why SF prices (and SF Bay Area prices) rose as much as 20% a year during the bubble. Was San Francisco in 2004 that much more desirable than San Francisco in 2002?
The median sales price for SFRs in Noe Valley in 2003 was $870k and in 2007 it was $1.4M. That’s a 60% increase! Mix yes, and gentrification, I guess, but mostly just bubble and froth.
45 yo hipster,
Does your premium include neighborhoods that in my opinion are not even what most would think of as San Francisco? I have no problem with Russian Hill or Cow Hollow being as expensive as parts of Beverly Hills-Beacon Hill-Lincoln Park, but I will never understand people paying prices for dumps in outer neighborhoods overlooking freeways or nearby housing projects and STILL paying a premium for a San Francisco mailing address.
The idea that for the cost of a nice house in Bernal I could buy something in a far better neighborhood in some of the other great cities of America should give pause. (forget Waco, try L.A., Chicago, Boston, Seattle where 1.5m still goes a long way) I could pick examples of what you could get in other cultural-class cities, but San Francisco provincialists will pick them apart (“too cold in winter”, “I would never live in L.A.”, etc.). Your point is well taken, people do not come to expensive cities for the weather or to worry about smog and traffic, they come to be a part of the creative energy and are attracted by opportunity and high income potential. Right now, even with the current reductions, less prime San Francisco neighborhoods are still pricing themselves as if they were the prime parts of the other great cities. An outer Sunset dump is the same price as a desirable neighborhood home in other cities on the “creative class” list. I have watched employees again and again choose to relocate out of the Bay Area after they stop drinking the Kool Aid that this is the only area where they can make money and meet interesting people, leaving instead because of the cost of housing here.
There is life outside the bubble. There are other interesting places to live at less cost.
Renteragain/anon2- your points are certainly valid, and the ultimate results are bourne from the collective choices that people make. Real estate has come down across the country, and in most places. But I don’t think SF will go down more than most of the other creative type cities identified in floridas study. (Austin, tx may me an exception, but it also had a much smaller rise in the 2000’s). As a matter of fact, at this point SF has lost less value than most USA metros.
There always has been and always will be competition from other cities. And plenty have moved out of high priced SF. BUT, plenty have also moved in. There really is a mix of buyers. You now have a trend in well to do families choosing Moe or Cole valley over say palo alto or marin. And the usual mix of singles, childless couples, gays, retited, multi home owners, etc. And there is almost always a steady supply of renters. Ultimatly I just do not see a wholesale exodos. And for those who seek a true urban experience (as urbanist jane Jacobs would say) there are few choices in this country. I’ve been to Austin twice. At its best It reminds me of the east bay. Nice people, interesting little nooks to explore, but no gestalt. You can’t walk from interesting place to intetesting place. Downtown is a yawn. It certainly has it’s appeals, but an urban experience it is not.
As a matter of fact, at this point SF has lost less value than most USA metros.
45YOH, do you really believe this? What do you base it on? If you look at Case Shiller (choose a different reference if you want), the SF MSA is down far, far more than just about every other metro area in the last year (only Phoenix and Las Vegas are worse). I know, SF and the MSA are not the same, but SF is in the MSA, and I have never (after 18 months of posing this question here) seen any evidence that SF is now or ever has been materially de-coupled from its neighbors as a whole in terms of real estate price trends, although I accept that all parts of the MSA are not affected at the same time. We are all a single market. And the SF-only medians certainly are way down–far below nearly all other metro areas (again, I know, far from perfect, but choose another reference if you like). From the evidence, it certainly looks like SF has less resilience than other metro areas. I love SF, but I don’t see it as any particularly special draw that will save housing prices, and even if one only wanted to live here and nowhere else, one can do so for less by renting.
http://www2.standardandpoors.com/spf/pdf/index/CSHomePrice_Release_022445.pdf
http://www.rereport.com/sf/
Following on what Trip wrote, there are a number of interesting comparative charts that Mish compiles every month regarding C-S and CAR data.
Although there are of course measurement issues with any time series data set, the latest data show that SF MSA has suffered one of the largest percentage drops so far and the absolute largest dollar declines.
Additionally, the C-S futures data (keeping in mind the inherent limitations of these thinly-traded instruments) are showing that SF MSA will enjoy the largest fall, both in percentage terms (-49%) as well as average dollar losses (-$403K). I actually think the falls for the SF MSA will be even larger than the futures indicate.
http://globaleconomicanalysis.blogspot.com/2009/03/case-shiller-and-car-analysis-february.html
Even after it is all said and done, SF will still be at a premium to much if not all of the country (I suspect that Washington DC will ultimately be more expensive than SF). However, the bubble distortions were so large, and the price levels so out of line with the underlying productive capacity of the population, that imo very large drops are inevitable (already occuring in most of the MSA).
45yo hipster, forget Arizona, Austin and Florida. You really need to compare urban “apples”, which are Chicago, Seattle, Boston, etc. There are other walkable cities with “creative class” high earning jobs besides San Francisco. Remember, some of our WORST neighborhoods are charging housing costs that are what some other cities (Chicago as an example) charge in their BEST neighborhoods.
In general MLS data shows that SF proper has fallen about between 5-15%, an average of 10%. That is minus d10 (which is stabilizing due to recent volume incr), the high end (which recently started to slump) and soma condos (due to volume and pressure on the developers). And anedotal evidence so far suggests that it is stabilizing at this mix- we’ll see as spring ensues.
And no Lmrim! That is exactly my point- prices are not out of line with the productive capability of the population. Please comment on the Florida study and the ‘superstar’ cities studies that were done. I dont see you factoring in ANY of their points. You also exclude legacy RE. More and more SF RE is passed on in the family. Or an established family helps their kids get a foothold in SF. (no, these are not most of the sales, but they are a substancial portion). Sales volume is still low in SF due to these factors. And I think it will stay relatively low during the recession. I don’t forsee a ‘dumping’ of properties like we have already seen in other markets.
“And anedotal evidence so far suggests that it is stabilizing at this mix- we’ll see as spring ensues. ”
Hmmm… my observation in Noe is that houses that would have sold quickly in 2006/2007 are sitting. Which probably means the asking prices are too high, so sellers haven’t adjusted expectations enough. (And perhaps buyers are waiting for 2010 prices.) There are so few sales recorded since Oct 2008 that I think it’s premature to call the percent drop or to declare that prices have stabilized.
A few potential apples I’ve got my eye on (sorry if I screw up the links):
70 Vicksburg
(purchased for 1.41M in 7/2005, asking 1.549M, on the market for 57 days, plus on the market briefly last fall)
3963 22nd st
(purchased for 1.337M in 12/2006, asking 1.295M, on the market for 41 days)
3730 26th St
(Purchased for 1.25 M in 6/2004, asking 1.148M, on the market for 26 days. Arguably not in Noe, but the 2004 buyer paid a Noe price.)
“That is exactly my point- prices are not out of line with the productive capability of the population.” I really think they are out of line, but don’t have any data to prove that. If lending requirements for jumbos stay strict, then we should know the answer in a few years.
I have never (after 18 months of posing this question here) seen any evidence that SF is now or ever has been materially de-coupled from its neighbors as a whole in terms of real estate price trends
This is because you close your eyes and ignore any evidence that doesn’t support your hypothesis. Just pull up DQ News and you can see how wrong you are. The exact same people who claimed that “mix” was such a critical ingredient in artificially distorting reported prices during the boom years now claim that it is a non-factor, when even to the most casual observer, it has a huge impact in reported MFA price declines.
Come on, NVJ. You’re pointing to DQ data on medians in one sentence and then arguing about mix — i.e. distorting medians — in the next.
I have never argued that declining medians proves declining values, and I expressly noted this problem in my post above. All I’m saying is that there is no principled reason why the market in SF’s immediate neighbors ever would come un-glued from SF proper over anything but the very short term, and nobody has even provided a shred of evidence to the contrary. The numbers you point to are consistent with this — the low end areas (in SF and throughout the MSA) got socked first, and now the higher-end areas (ditto) are catching up. It’s all a single market and a single continuum.
Trip-I don’t follow u at all. Are u saying that as the bay area goes/went down so will SF? But didn’t outer areas of the bay start their declines mid-late 2006? And ‘real Sf’ only started say mid 2008? 2 yrs diff is substancial.
Also, while Pittsburg and concord ate down, what, 40-50%, SF is down ~10%. Quite a difference. And it’s not just SF. Pall alto, piedmont are also down much less than outlying areas.
Of course diff areas will decline at diff rates. And ad for coupled/decoupled, SF was decoupled for about 2 yrs, but because the recession is pretty severe even SF has started to see price declines. What’s so complicated about that?
These guys all have internalized a potential future in which much if not all of SF actually does drop 40 to 50 percent. The two year lag is explained by their embrace of something that may never come to pass. Direct correlations of macro trends are applied. Even calculated! This despite evidence to the contrary in the precise form of a two year lag, a lag of a turn that isn’t as severe as surrounding areas! This is where they argue from. And this is precisely why every single post they make is sort of a flame. It’s always “wait and see.”
But in the meantime they still speak archly, as if those who are in the marketplace at this late date noticing five to 10 percent off peak markets are the fools. Oh, and the examples of calamity? Almost always people who hold properties for three years or less with minimal or no improvements. As if that was ever a great idea, historically.
You gotta call them out now, though. When it all turns out differently than the grey future they pretend to look down their noses at us from, they won’t be around to take their medicine.
45YOH, where are you getting any of those numbers or dates? I just don’t buy them (but I would accept them if you show me any support).
Here’s what I’m saying. There is no reason one would expect SF prices to rise or fall significantly differently from its immediate neighboring counties. It’s all a single market — prices get too high in SF or Mill Valley, and people buy in Berkeley or Walnut Creek, disciplining prices in SF and Mill Valley. Too high in Lafayette and people buy in Concord. And so on. There are some people, of course, who only want to live in SF, and there are others who would never live in SF (so dirty, so crowded, so many homeless . . .)
I concede I have not spent a tremendous amount of time digging through all the listings and data in neighboring areas (so I could certainly be proven wrong), but what I have seen seems to indicate the different timing and rate of the crunch is more property-type based than geographically based. The two generally go hand-in-hand as nice places tend to be near other nice places and vice-versa — that’s why it is easy to conflate them.
Thus, the “real SF” kept climbing until about mid-2007, while poorer parts of SF had already started getting hammered a year earlier. But you see the same thing in “real Walnut Creek” vs. poorer parts of WC and “real San Rafael” vs. poorer parts and so on. This has to do with the fact that homes in poorer areas were driven up by subprime loans, and they started to crash sooner because that spigot was closed off sooner (early ’06). Meanwhile the easy no-down Alt-A and prime lending continued to flow to nicer areas into 2007, and lo-and-behold, prices continued to rise where money was still easy. But that started to get cut off in late 2007, and the trend really accelerated in 2008.
So the stats show, say, Pittsburg or SF D10, being slammed at present harder than “real SF” or “real Berkeley” because there are more cheap homes in Pittsburg and D10, and those started to get hammered earlier. But all price points saw roughly the same run-up percentage-wise since the mid-90s (the low end likely saw a moderately greater run-up) driven by cheap money lent to anyone with a pulse. That is all over now — although it was cut off at different points in time for different borrower classes — so it is all coming down. The “real” areas are just about 12 to 18 months behind the poor areas but following the same trajectory. Prices fall in the Bayview or Portola, which causes them to fall in Bernal (because otherwise you just go a few blocks away and buy in the Bayview or Portola), then in Potrero and the Sunset, then Noe, etc. The one big change, I think, is that the epic market crash and lending freeze has now accelerated the decline at the high end, while GSE/FHA programs have slowed (but not stopped) declines at the low end.
Again, I could easily be proven wrong, but one would have to show me some real data to do it, or explain how there can be a fundamental difference between SF and its neighbors only 5-25 miles away that never manifest itself before (and every attempt to demonstrate here that SF is “unique” has failed miserably when tested).
Trip, let me make sure I’m understanding what you’re asking. You want hard data to show you that Berkeley and Belvedere are actually quite different than San Francisco?
There’s nothing else very much “like” San Francisco in this region. I don’t need data for that. It’s a fact.
Sorry, fluj. I gave you a lot of respect, time, and good faith consideration. But life’s too short. I’ve learned a ton from this site and I expect I will continue to do so, but I’m not paying attention to you anymore. You stopped debating on the merits or contributing anything worthwhile months ago.
Oh, so when you say the following,
but one would have to show me some real data to do it, or explain how there can be a fundamental difference between SF and its neighbors only 5-25 miles away that never manifest itself before (and every attempt to demonstrate here that SF is “unique” has failed miserably when tested).
you are not saying what I just paraphrased above?
You want to read about real fundamental difference that has not manifested itself before?
Pick up a magazine. Do an internet search. Read about the 21st century’s trend toward urban centers.
Please. You want to talk about disingenuous lack of contribution. You have blinders on.
So have fun exchanging the same tired sentiments arguing from the standpoint of an unrealized future time with the usual suspects.
Trip wrote: “There is no reason one would expect SF prices to rise or fall significantly differently from its immediate neighboring counties….Prices fall in the Bayview or Portola, which causes them to fall in Bernal (because otherwise you just go a few blocks away and buy in the Bayview or Portola…”
In fact, prices haven’t gone down in most San Francisco neighborhoods nearly as much as as they have in parts of the East Bay. There haven’t been anywhere near the number of foreclosures here in SF as in Contra Costa County. And no matter how cheap Antioch gets, most San Franciscans aren’t moving there.
I live in Bernal, and wouldn’t move to Bayview or Portola (each quite a distance from me, actually), let alone Antioch.
Some of the same factors are affecting real estate everywhere, but some places have been significantly different than others so far. In the last downturn, in the early ’90’s, different neighborhoods and different cities were affected differently. You are entitled to your guess as to what the future will bring (and perhaps your guess will turn out more accurate than fluj’s) but it’s still just a guess.
Trip, so you fire up DQ News and see that the 3 Vallejo zip codes are down -50.9%, -52.9% and -36.3% and have 50+ sales each. Then you see the SF zip codes are down much less, in some cases even positive and you decide from this evidence that you have proof that these markets are strongly correlated?
I guess you can convince yourself of anything, in spite of any evidence of the contrary, if you start with your mind made up.
NVJ, you know that’s a red herring. Solano County is not in the SF MSA (at least not as, say, Case Shiller defines it — whose SF MSA index is down 40% from the peak). And I don’t think a significant number of people consider SF and Vallejo as substitutes — i.e. they are not in the same relevant market. So, no, I have nothing to say one way or the other about Vallejo. (However, I would bet that nicer, higher-end homes in better Vallejo neighborhoods have not fallen as far — yet — for the same reasons that higher-end homes have not fallen as far yet in SF. The high-end is trailing the low end for the reasons I noted above.) See:
http://www.redfin.com/CA/Vallejo/6224-Pebble-Beach-Dr-94591/home/2342224
http://www.redfin.com/CA/Vallejo/183-Zinnia-Cir-94591/home/2306987
Also, DQ reports median sale prices, remember? You don’t think those accurately reflect the market — and I agree — because they have become skewed toward lower-end purchases with the lending freeze.
This is just a theory — it could easily be disproven but the facts seem to support it. It just makes no sense that SF’s immediate neighbors would see 40% declines (per CS) and comparable SF homes would see substantially less — because people would shun SF and buy next door, equalizing prices. The timeline for the crashes in the various market segments is pretty consistent throughout the SF MSA and is not pegged to any city per se. The low-end subprime market in SF and elsewhere got hammered first, and the higher-end is falling the same, but 12-18 months behind in the trend. So it’s not that “SF is better” or “Belvedere is better” and “Novato is worse” or “Concord is worse.” It’s just that SF and Belvedere have a lower proportion of low-end homes and poor neighborhoods so as a whole they are later in the trend. It has little to do with geography and much to do with the type of borrower.
How about Richmond and Oakland then? Are they part of the area that you think are substitutional and therefore strongly correlated with SF prices? As I am sure you can see, some parts of Richmond are down -70% just this year.
You claim that SF and the surrounding metropolitan areas should be strongly correlated in prices and that you have not seen any evidence of the contrary, then when presented with some evidence, you find various excuses why you want to discard this data. In fact, you haven’t presented any actual evidence in support of it. If you have any, I would be happy to look at it.
Show us the long term correlation, say back to WWII, between the two asset classes, and I would be convinced.
You might even be correct, but so far the only “evidence’ you have of it is a prediction for a future event that hasn’t happened yet, which is almost the definition of circular logic.
That is not to say that home prices will not go down in SF: they have gone down in every recession in the past, and I expect they will do so in this recession. But all of you claiming “this time it is different” haven’t really provided a mechanism for why this is so, other than some unspecific catastrophic future event. The speculative fever which gripped neighborhoods even 20 miles away doesn’t seem to have been much of a factor here.
They’re not correlated, they’re coupled. So it depends on the system dynamics how that coupling will express itself as prices changes propogating across the area.
Some parts of SF are down around 70% too:
http://www.redfin.com/CA/San-Francisco/463-Sunrise-Way-94134/home/791818
And some parts of Oakland are not down nearly that much (yet):
http://www.redfin.com/CA/Piedmont/126-Dracena-Ave-94611/home/642433
You write: “all of you claiming ‘this time it is different’ haven’t really provided a mechanism for why this is so.” But I’m saying just the opposite — this time it’s the same as every other time. SF real estate would be expected to move right along with its immediate neighbors, as I’ve discussed above, and I’m predicting nothing has changed and it will continue to move in accord with its neighbors. Feel free to provide any evidence — or even a theory — as to why you think things have fundamentally changed or why my premise is wrong.
I’d guess there is a significant lag in real estate values when we are talking about substution effects and the reestablishment of equilibria among different areas of a coupled region.
We’re talking about average, unsophisticated buyers/sellers here. Reality takes a long time to dawn on people, and in any event most wait for the confirmation of trend change that smacks them on the head when their neighbor can’t sell his property and/or dumps it in a firesale. All the behavioral biases then come into play to “explain away” the data, the most typical being the “seller overpaid” or “it’s all very micro”.
If it were possible to short individual houses, you would see faster adjustments to equilibrium, because more sophisticated speculators would drive down the prices to a more sustainable equilibrium condition.
As it is, the behavioral biases (in particular, the unwillingness to recognize a “loss” – either from purchase or from some supposed high value anchor point) will ensure that the adjustment is slow and characterized by low volume in the areas that are being ratcheted down to match the new equilibrium price levels being established by the areas in which these biases are not so profound. These behavioral biases are not so profound in the outlying areas in the Bay Area (and in lesser neighborhoods in SF proper) b/c so many people had $0 skin in the game. It was actually a rational choice (value maximimizing) to just stop paying even when one could afford it b/c of the ability to live rent free for a long time until foreclosure.
The dynamics of the downturn so far are exactly what one would expect, in particular the sales volume declines in the “better” areas.
I’m going to count 463 sunrise as the first robin of spring. From property shark it looks like the timeline is:
purchased $690K 7/07
repoed $579K 4/08
dumped by the bank to a private citizen $261K 2/09
62% below it’s peak bubble price
Even if I were alive I couldn’t help them.
NVJ, you raised a valid criticism of my underlying premise, that I was just assuming (through common sense and a knowledge of how relevant markets work) that SF real estate values tended to move in accord with the SF MSA as a whole. I found some data to test that premise. I used SF data on SFR sale prices going back to 1987 by district from Blackstone Realty: http://blackstone-sanfrancisco.com/198.html
(I’m working on an appellate brief and I’m bored, so) I plotted each of the 10 SF districts along with the Case-Shiller data on the MSA from 1987 to the present. It is not perfect since Blackstone uses average (medians would be better) sale prices for the districts and CS uses a repeat sales apples-to-apples methodology on SFRs. But it’s the best data I can dig up.
The correlation is extremely close — i.e. prices rise and fall together and by about the same % — even across each individual SF district and the MSA as a whole. There are outliers, of course, particularly in thinly-traded districts, but the lines on the chart move up and down pretty tightly. The correlation breaks down only in the last two years. The CS data shows a modest MSA decline in 2007 while each SF district was up moderately, except Ds 8 and 10. And in 2008 CS showed a 31% decline for the MSA while the SF districts showed more moderate declines (except D3 was worse) and even 3 districts with increases. I think the Blackstone SF data skewed higher in recent years because it uses averages, but that would take further analysis.
So the 20-year correlation among each of the SF districts and the MSA as a whole is pretty sound. The question remains open, of course, whether the correlation will hold over the long run or whether something fundamentally changed in SF to cause it to break away. I think the former, for the reasons I’ve discussed above — but it’s just a prediction. The data on Blackstone shows big declines in SF in 2009 to date, but there is no CS data yet to compare it to — indications are we are already resuming the long-term correlation (again, as one would expect, in my view).
I do appreciate your keeping me honest in an adult manner without simply saying “you’re wrong.”
There you go again with the MSA! Point to any relatively central or northern neighborhood in San Francisco. I will find you numerous near peak or better sales that have transpired within the last several months. Is that what was happening in Richmond a year ago? I think not.
And I’m sorry, but your “Priced out here so move to Berkeley” take was countered. You responded with “Stop being mean to me, fluj.” If you look at this thread I said not one personally insulting word to you. You’re a lawyer, right? How is it that you are so inclined to make a big statement and not be challenged about it? You are not fronzi or LMRiM. Those guys are worthless.(Fronzi a totally worthless petty liar, LMRiM worthless when it comes to SF r.e.). Diemos, Tipster and I disagree all the time. Those guys are extremely vocal e-bears. But they aren’t babies.
— the “troll”
and p.s. @ LMRiM,
“Reality takes a long time to dawn on people”
Reality! Do tell, Mr. Possible Future Times Platform. LOL.
I sure wish I could see your graph, but I will take your word for it. Perhaps you could mail it to the editor and he could post it on the site – it seems like it would be a good topic for its own discussion. This is strong evidence for your position.
I was under the impression that outlying areas were subject to a much greater run-up over the last 5 years than the City of SF proper. I have this from memory of DQ News reports, as well as from the “three tiers” CS discussions, were we often us the bottom tier as a proxy for the outlying area appreciation. I will see if I can dig up some old DQ data to verify.
I will take a look at the Blackstone data some more when I have time, hopefully tonight. Thank you for a reasoned discussion, you have made some good points.
I can email the excel spreadsheet to you if you want to open a “single-use” gmail account (but not before Monday — I’m going home).
There is a lot of noise given the relatively small datasets, and also the different data methods (averages vs. repeat sales), so there is much to pick apart. But I was surprised at the pretty tight correlation not only between SF and the SF MSA but even among the individual SF districts (and the MSA) over the last 20 years. I had assumed certain districts outperformed others by a ton (D5 is the standout). And again, there is clearly a divergence in the last two years (closing a bit in recent months) — so the debate is still unsettled over what the next few years will bring. You know my thoughts.
I charted the two data sets here – SF Case Shiller versus the blackstone averages by district. The SF CS is the solid black line, the SF districts have gray circles:
http://chartmechanic.com/chart.jsp?c=demo/SF%20Case%20Shiller%20District%20Mashup.chart
The right axis is for the case shiller index, and the left axis for the prices by district. Keep in mind that the case shiller index is a monthly series, whereas the prices are annual. The horizontal axis is of course time.
The check boxes to the right of the chart let you toggle different series on and off, or the recession marker bands.
If you compare any SF district by itself to the index (turn off all other series) they correlate pretty well IMO.
For the curious, you can also play with some of the related charts (bottom of the page) that plot volume versus price by district, from the blackstone data.
Excellent work, gumby. Your charting skills far exceed mine!
Great work Gumby, thanks. What is really strange is that in no prior downturn was there a delay in SF prices dropping. They always dropped along with the SF MSA, or even a bit early, in 2000.
That’s a cool chart. Yeah, data size is going to limit it. But go back and really look at it. Almost every neighborhood is still above 2004 levels, and that’s when the market broke north.
Sorry annon, but I look at that chart and see a clear run up that started around 96-97 with a hiccup around 2000-01.
We shall have to get together on Jan 1, 2012 to compare notes and decide who was seeing what they wanted to see in the data.
No, you don’t. Check neighborhood by neighborhood and look at right now versus 2004.
Yes, I do. Prices are currently around 2004ish levels and headed down. I have no idea what mechanism you think is going to stop prices at this point.
“and headed down.”
sez you.
You also were one of those who looked at a lot of things featured on this website in 2007 and said the same thing. And nowadays guys like you are all “back in the peak days of 2007.”
Late 2004 was the sea change. This chart at best shows a regression to 2004. Your “headed down” thing is not a reality. It is your assumption, only.
“mechanism”
Why do I need a mechanism? I’m the one reporting and talking about current levels. You’re the one who needs a construct.
“It is your assumption, only.”
“I’m the one reporting and talking about current levels.”
And there is a core conceptual difficulty. Any statement about the future is by necessity a model. If you’re going to restrict yourself to only looking at how things are now, the future will always arrive as an unknowable and unforeseeable shock.
To make a silly analogy. It’s a bright sunny day here in SF as I type these words at 3PM in the afternoon. I turn to my friend annon and casually mention to him, “At 9PM it will be dark.”
He replies, “What? You can’t know anything about the future. You’re just guessing.”
“No, I have a model of this night day thing. That the earth is a sphere that rotates around it’s axis once every 24 hours and it’s day when it points toward the sun and night when it faces away. So since I think I know the rotational velocity and axial tilt I think I can predict when we will have day and when it will be night.”
“Well, all I know is what I see right now and it’s bright and sunny so I don’t know why you keep talking about darkness.”
To which I can only reply, “Okay. Whatever you say boss. When 9PM arrives we’ll have to see how good my model was.”
Silly indeed. Your analogy contains finality. Your supposition does not.
Diemos, I have deduced you are not writing from Alaska.
So does Double Cross Vodka pay you a referral fee?
I was at a conference in Poland once where they served iced Chopin Vodka at the banquet. It was pretty damn good.
“I have deduced you are not writing from Alaska.”
We’re close enough to the equinox that today it would even be true in Alaska. 😉
DoubleCross pays me in drinks. Plus, I’m angling for the West Coast rep. job when they come out here next year.
Maybe your on the moon, or in the space station 🙂
What gumby’s nice charts show is that this supposed disconnect between SF and the rest of its own MSA does not exist through 20 years of fairly decent (not perfect) data. There have been short periods where one SF district did better, or was better or worse than the MSA as a whole. But over time they catch up and move together, just as one would expect. The MSA has fallen farther than most SF districts in the last two years. And it’s theoretically possible that the 20-year correlation has now been broken. SF is already catching up (er, down) quickly in 2009, and unless someone can propose some reason why SF and its neighbors a very sort distance away should become un-coupled with respect to housing trends, the smart money is on the longer-term correlation remaining tight.
When Case Shiller data come out on Tuesday, any claims that “the MSA is not SF!” should properly be disregarded.
“When Case Shiller data come out on Tuesday, any claims that “the MSA is not SF!” should properly be disregarded.”
poppycock
Those graphs should all start at the same scale in 1987, not have the same value in 2000. If they had the same scale throughout, you would see more clearly the fact the District 5 outperformed the SF MSA the whole time. Actual underperformers, like D4 and D2, look like they lead because they start too high. But that is a pretty minor quibble.
I can think of plenty of mechanisms how this could happen Trip and many of them have been discussed on this blog over and over again. The most obvious being the likely hood that speculative money was directed more to certain markets. In ever other downturn, SF came down at the same time and with the same magnitude as the rest. Why is it different this time?
And why do you expect there to be a 50% correction, as opposed to every other post-WWII downturn, which was in the 15-25% range?
I have no idea what mechanism you think is going to stop prices at this point.
I think its pretty clear that massive drops in most localities are due to REO capitulation. We have yet to see that in “real SF”. I do believe that ARMaggedon will lay waste to even Ess Eff (and Piedmont), but at this point the NODs and NOTs aren’t there. It is only the availability of financing and people realizing that the next burg over may offer competitive housing that drives down SF prices. Oh, and those savvy few who do the buy vs. rent calculations. Bear in mind that I use Trulia for my foreclosure data, so it may not be as up to date as a fee based service.
Nice chart, gumby. Great work, and much appreciated. It would be great if it could be updated as new data comes in – perhaps the editor could embed it somewhere and update it as the new data comes in?
LOL at the idea that this is normal downturn, and that SF prices are declining due to the recession. The downturn began well before the recession did – if anything, rather than the other way around the downturn is being caused by the housing slide (not really, but the credit deflation that is causing the recession/depression process that is beginning is what is causing housing values to fall).
About the “scale” issue in the chart, it’s not log normalized, or adjusted to an index level at the district level. But just eyeballing, the correlations appear pretty strong at the district level (and of course by implication even stronger at the “SF” level, aggregating the districts). If you check one district box at a time, and do a little mental transposition to account for the fact that at the beginning of the data series there is a difference from one of the series (expressed as an absolute $ figure) and the other (expressed as an index), it’s pretty clear imo.
There has been a small but likely significant outperformance of D5 over the period 1987 to 2007 (before the “decoupling” that we are trying to test) – on the order of 0.75% annually. Some of that, however, is probably explained by the “average” prices that are used in the Blackstone data, the absence of a repeat-sale methodology in that data and the presence of expensive remodels/flips that are going to affect “glamour” nabes more than others in the “boom” periods.
Again, overall I wouldn’t expect to see any huge disconnect with the MSA even at the district level over any but short time periods. Of course, there will be differences at the individual house level, street level, and neighborhood level (in decreasing order of significance) because “it’s all very micro, bro”, but the relatively low turnover of houses – and the influence of prop 13 which makes residents reluctant to relinquish ownership – ensure that the true change in the character of a neighborhood or district that would allow for a real disconnect from broader trends must be very slow in coming.
“And why do you expect there to be a 50% correction, as opposed to every other post-WWII downturn, which was in the 15-25% range?”
Because, unlike every other post-WWII downturn, price/rent and price/income ratios diverged from their long term values by a factor of two.
I’d like to thank gumby too for the great chart. I’m hoping Chart Mechanic has a free version.
As info and as gumby noted, the sales data by district comes from the Blackstone realty website. Blackstone uses mean sales price from the MLS – not the median. On the MLS system it is referred to as the Average, but it is the arithmetic mean. It is still valuable data – just keep in mind that it is the mean not the median.
Also as info, I don’t know Blackstone’s methodology, but I suspect he updates his table shortly after the close of each period (year) and then doesn’t update it again to include any late reportings that may have occurred. This is no big deal, but his sale counts may be very slightly understated compared to what eventually get reported in the MLS. The effect on the mean sale prices is pretty immaterial. But the Blackstone tables are great – plus they go back to 1987 which shows the 1991-1994 declines (MLS only goes back to 1993 or so for live data).
Here’s a little graphic to help you understand NVJ.
And another little juicy tidbit from the california association of realtors for the group to chew on.
Re: the unimaginability of 50% declines.
Diemos, the San Francisco Bay area is the city or MSA?
Good data by the way.
MSA.
And before flujie chimes in with his usual objections about how no one can explain why it hasn’t happened in SF proper.
Real estate prices are sticky and will reset down to their equilibrium values only when there are forced sales. Forced sales haven’t hit SF proper yet. Loan resets and job losses are coming, they will cause forced sales.
And before flujie objects that I cannot predict the future I’ll say two things.
1) January 1, 2012
2) At 9PM last night it was dark.
diemos – good charts. The CAR chart in your 9:06 post – those were median prices, right? In the case of Sacramento, the peak month was way back in Aug 2005. But 42 months later it is still declining and hit a new post-peak low in Feb 2009. The median is back to the 2000 level. (The March median is showing a very slight uptick for Sac.) I suspect that Feb 09 was a post-peak low for most or all of the regions indicating that there is no trough in yet?
Sorry for the confusion, it’s not my chart. Here’s the article I liberated it from if you want the full details.
Yes I have seen that chart before, thanks. FAB and I were posting about the housing bubble over on Patrick.net long before this blog even existed.
That CAR chart of yours diemos is really amazing, even considering the “beauty pagent effect” on the way up and the “default effect” on the way down, those numbers are flabbergasting. I still expect that the home price correction will be a long, drawn out affair, taking much longer than 2012 to play out. I have to admit that the correction happened much faster in some regions than I expected.
But we shall see.
“FAB and I were posting about the housing bubble over on Patrick.net long before this blog even existed.”
ah, I hung out at the Ben Jones blog during that period.
I’m glad people found the chart informative. A couple points:
While it would be nice to normalize the district prices to an index (say 100 in year 2000) so that they scale uniformly, there’s nothing deceptive about it as-is. Normalizing the price series would be useful for comparing districts to each other. The point though was to illustrate the “does real SF correlate with the broader MSA or not?” question, which seems to arise repeatedly here. Compare any single district to the CS line, and draw your own conclusions. Also, both Y axes are zero-based – charts that are not are generally a pet peeve of mine (sometimes misleading).
The chart will update automatically as the source data (here, the blackstone site and Case Shiller) update.
I’d gladly publish more charts of interest. It’s sometimes hard to find the data though. Anyone have the equivalent of the blackstone data using median instead of mean, for example? The ChartMechanic site lets you mash up all these time series, and keep the data updated, assuming it is published somewhere on the internet. Or else, excel/CSV can be uploaded manually.
Another interesting chart from the blackstone data, price and volume for a given district. I’m more curious where volume ends up for 2009 than price:
http://chartmechanic.com/chart.jsp?c=dave/SF%20Prices%20and%20Volume,%20D5.chart
Oh, and a series where price is adjusted for inflation on that one, too.