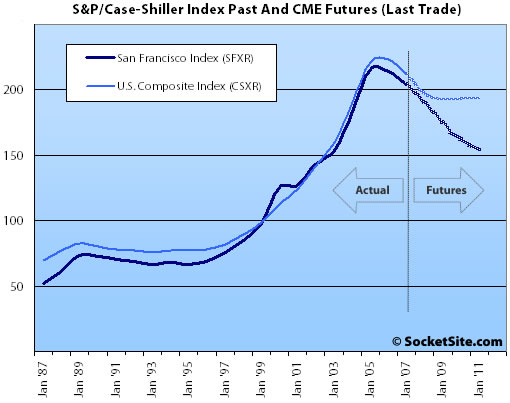
It was a little over a year ago (May 2006) that housing futures based on the S&P/Case-Shiller index for ten Major Metropolitan Areas (as well as a ten city composite) began trading on the Chicago Mercantile Exchange (CME). And it was last week that the market was expanded to include contracts of up to five years in duration.
A few important things to keep in mind: liquidity and open interest in the CME housing markets are painfully low; the “San Francisco” index includes San Francisco, San Mateo, Marin, Contra Costa, and Alameda counties; and the index is based on changes of single-family home values (and not condos). That being said, the market does represent real traders betting real money on movements in the local housing market.
And what say the traders about the San Francisco MSA? Well, as of today traders on the CME are betting home values in the San Francisco will drop almost 7% over the next year; 14% over the next two; and a total of 24% over the next four (down roughly 7% a year). And that’s the second to worst four-year performance of any of the ten markets (with traders betting that Miami will drop 25%).
Again, it’s a thinly traded market with significant bid/ask spreads (especially on the longer duration contracts), and it’s not specific to “San Francisco” county. But these are real dollars at work. It is another data point worth watching (if not for magnitude, then at least for direction). And yes, we’ll keep you plugged-in.
The actual CS numbers for July were released today. They show the recent trends in SF and nationwide continuing — with SFR prices in the SF area down .4% from June to July and down 4.1% YOY. The reported data still reflect conditions even before the mortgage meltdown in August. We’ll get a more clear picture of current trends with the August and September numbers — the futures markets apparently think that the downturn will accelerate and we’ll be back at ’04 prices early next year.
Isn’t it funny how all of the bears have now completely latched onto the SFMSA now, instead of looking at the city proper?
Isn’t that because that is how the data is reported?
If you have the CSI for just San Francisco County why not submit it as a tip for it to be posted or just add it to your comment.
Personally, I would love to see it.
Boy, I don’t see all those cranes in the sky in Mountain View like I do in SF. The supply in SF continues to explode unlike ANYWHERE else in the SF MSA.
Over the last 20 years, prices in the SF MSA track nationwide price trends with nearly a 1:1 correlation. If someone wants to assert that SF trends do not even track the SF MSA, which includes SF and a few neighboring counties, go ahead and try to make that absurd argument, but you have to prove this unlikely disconnect with some firm data. I’ve never seen anything even hinting that this is the case.
The largest market for these options are investors from the home building industry. They are using these tools to hedge their risk, that’s one of the reasons there is such a bearish outlook.
I don’t trust anything with Standard and Poor’s name on it now.
hedge is right. the futures index has been down since it started and Shiller himself says this is predictable due to hedging.
Also, the biggest problem I have with CS for S.F. is that the portion of the transactions that come from S.F. in the MSA is small. Because half of all transaction in S.F. are condos, you can use the Dataquick data on the number of transactions in each of the counties in the MSA (I assume 90% SFR sales in the other counties) and conclude that only about 6% of all transactions in the S.F. MSA for Case Shiller are S.F. sales. I think it is reasonable to assume that declines in Alameda and Contra Costa- which make up nearly 75% of the transactions in the MSA- are responsible for most or all of the 4.1% decline in the index.
If Case-Shiller would release it’s data for S.F. only, we could know the answer to this question.
One of the reasons I like this blog is the usual impartiality (relative to bull market BS on most SF real estate sites). But this post falls on the same old tricks that all the other sites and the main-stream-media do. Using a big, attention-getting headline “They’re Betting Against Us (San Francisco) On The CME” and then in the fine print explaining how it’s really the MSA. We’ve covered this caveat here many, many times but the headline use strikes me as sensational. (See similar SFChron headlines ala “Foreclosures Skyrocket!”)
If you do put any faith in a thinly traded futures index and want to factor it into your buying/selling decision, it would behoove you to look at the individual components in the MSA and see what’s driving the index. Do you think Contra Costa and Alameda might be having a slightly disproportionate impact here? Just maybe?
Might be worthwhile to look at the increase in recorded trustee deeds in those two counties for Q2 and the # of homes relative to SF county. According to Dataquick, Alameda up 600% and Contra Costa up 1,200%. Alameda has 10x the number of foreclosures of San Francisco. Contra Costa has 15x. Now, do ya think those might skew the data at all?
I’m no real estate bull but the cute little tricks here are just as annoying as the little tricks that the real estate bulls (aka agents) play on their sites. No one is betting against “San Francisco” on the CME despite the headline. To lead readers down that path is disingenuous at best.
And can I stop having my comments deleted? I come here and post in a civil manner, staying on topic and trying to add value to the conversation. Can’t understand why I should be censored…
[Editor’s Note: Fine print? It’s in bold (“important things to keep in mind”), we mention it twice in four paragraphs, and we’re usually the first to note the difference. (But hey, point taken.) And in terms of your comments, our backend shows that only one of your comments has been removed. It was a question about our use of the first person plural rather than the property at hand. And we actually responded to your question directly with an email to the address you provided along with your comment. Regardless, and as always, thank you for plugging in (and keeping us honest).]
I’m as bearish as anyone, but Dave is right: these futures are too thinly traded to be useful. Last time I checked, open interest on the SF contracts was under 10 per maturity. So basically, one large hedge fund trade can shift the backwardation pretty easily. These have been showing ~7% backwardation for months now, with a few bumps.
And to Trip’s point, it’s naive to assume that San Francisco’s market has absolutely no correlation to the east and south bay. A year ago folks in the east bay thought that the trouble in the central valley would never hit them….
Boy, I don’t see all those cranes in the sky in Mountain View like I do in SF. The supply in SF continues to explode unlike ANYWHERE else in the SF MSA.
Perhaps you’re not looking hard enough, tipster. Take a drive down the peninsula and look off to the left hand side at Moffett Field (part of Mountain View). You’ll notice two large office buildings being constructed (two of the first speculative large buildings built in Sili Valley since the bust)
Guess what one of the largest demographics of buyers of SOMA condos is? Silicon Valley commuters…could the two be related? Nah.
Well “Dave”, I think some of us like these fluff pieces. If you look at the graph in the post on the year-to-year change in the S&P/Case-Shiller index, it pretty well illustrates why one might “bet against us”. The significant spikes are magnified for the SF MSA, so I’d bet the same if I were a futures type. It’s just another piece of data…
And I don’t see what’s wrong with a clever headline.
I have seen the complaint about the CSI and the fact that is only track SFH home’s which make up only half of what is already a small number to begin with.
But let’s keep in mind the resale SFH are the least likely to drop in price.
While it might sound nice to see SF county specifically in the CSI the problem is the number of transactions is so low that the numbers start to become unreliable. You need a reasonable sample size before any stat becomes reliable.
While the CSI is certainly imperfect the median has much bigger problems, in my opinion.
If the futures market is too negative, or too thinly traded, maybe you could put your money where your mouth is and sell a bunch of those futures contracts.
And if anyone else really believed that, they’d have already done it and made a mint.
So what if the majority of the index isn’t San Francisco proper? A significant drop in Alameda/Contra Costa prices will draw buyers out of San Francisco. Remind me again, what happens when demand drops?
This is very valuable and it’d be nice to actually have a link to the site as well as a tutorial on how to read the bid/ask as this is a very tangible data point on the market — even if the definition is broader than most people here are interested in (SF proper).
http://www.macromarkets.com
You can get full info on the index here, along with associated derivatives.
You only make money on futures if you can spot a disconnect between currently estimated spot price in the future and what the spot will actually be on maturity. The market has already priced in housing declines in SF, as the headline mentioned. The only way to make money selling these would be if the actual CSW index on maturity was more than 7% down on that date. If you sold a contract now, and the index went down 5%, you’d lose money even though prices fell.
Regarding aligning money to mouth, I’ve traded futures before, but admittedly lack gonads to trade these. Because of illiquidity, one hedge move can shift prices materially and trigger margin calls up to thousands of dollars per contract. These are not for the faint of heart. Caveat emptor.
So what if the majority of the index isn’t San Francisco proper? A significant drop in Alameda/Contra Costa prices will draw buyers out of San Francisco. Remind me again, what happens when demand drops?
I agree that there’s some correlation. But it’s tenuous at best today. The stuff that’s falling through the floorboards today in Contra Costa and Alameda is primarily all the subprime stuff. I don’t think the market in the prime of Berkeley has caved. It all depends on what you want.
Will a super cheap 2-bedroom house in crime-ridden Oakland draw away buyers from Pac Heights? No. But it may draw away buyers from Bayview. Unfortunately, that’s were the majority of rock-bottom bargains are in Alameda and CC. Unfortunatley, comparable stock in Bayview is also where the rock-bottom deals are to be had in the City.
If they start giving away 4-bedroom homes in Danville or Walnut Creek, that could definitely spark the interest of some condo-dwellers in nicer parts of the City. But people with better credit have yet to start losing their homes in droves. Unfortunately, that is what’s happening in the lower-end communities.
Time will tell though. I know lots of folks who got 5-1 ARMS in 2004. 2009 will be the year that most of them will either reset, refi, or sell. Lots of people may be in for a big surprise if rates keep going up.
Removing a lower-end buyer from the market has a much greater impact on the overall market than losing a multi-millionaire Pac Heights buyer as it impacts multiple move-up transactions. The $500K place doesn’t sell so they can’t buy the $750K place so they can’t buy the $1M place so they can’t buy the $1.5M place and all of a sudden we’re talking about Pac Heights and then some.
Removing a lower-end buyer from the market has a much greater impact on the overall market than losing a multi-millionaire Pac Heights buyer as it impacts multiple move-up transactions. The $500K place doesn’t sell so they can’t buy the $750K place so they can’t buy the $1M place so they can’t buy the $1.5M place and all of a sudden we’re talking about Pac Heights and then some.
Most buyers in SF in the 750 to 1 million range are not moving up from a 500k Bayview place. They’re leaving a rent-controlled apartment to buy their first place. Most in SF (not other places) would rather stay in a rental for a couple more years (since they’re protected from large rent increases) and save to buy the place in SOMA or wherever rather than slum it up in a 500k place in the Bayview for a few years. Costs are less and life is better.
The often cited number is a purchase by a first time buyer triggers 4 ‘move up’ purchases.
Take away those first time buyers, or even just reduce them, and the whole process begins to stall and then collapse.
Just remember there are two different “Dave” on this site..
I won the bet but am NOT the one commenting here…
🙂
I understand futures, but I don’t understand what specific assets are in these contracts. Any help? Thanks
No assets – you’re making a bet on what the CSW index value will be at the maturity date coinciding with the index calculation date (last Tuesday of every month).
Example: In March of ’07 the CSW index for SF was 211.09. Let’s say the June contract was trading at 205, indicating a 7% decline had been priced in. You sold a contract. The price could fluctuate up and down in the next 3 months. If it went up, you would be responsible for margin calls.
But upon settlement in June, the index value was reported as 209.48. You would have lost money – the decline was not 7%. So even though the index fell (you bet on the right side), it didn’t fall enough to be profitable.
Sorry, Dave. For the record, I go by “Dave”…
Sure demand is down but so are jobs offered in the Bay Area due to high costs. Here is a take from the BA leadership.
Carl Guardino, chief executive of the Silicon Valley Leadership Group, representing over 150 local employers.
He said…
Not only to the CEOs in the boardroom, but to any family you talk to in their living room. What we hear time after time from CEOs as well as frontline employees is how incredibly difficult it is to come here and stay here. That truly does have an impact on a company’s bottom line when the cost differential is so much higher here than it is in other regions around the state, nation and globe, or the ability to recruit top talent is also impacted.
You mentioned housing. It probably is the top concern we hear about in Silicon Valley from both CEOs and employees in terms of local issues. Does that have an impact? Let me put a finer point on it.
Hewlett-Packard and Dell are the top two computer-makers in the world. Corporate headquarters for HP are located in Palo Alto and Dell is in Round Rock, Texas. Obviously, they both have people and facilities around the globe.
In those two communities where their corporate headquarters are and where a lot of research and development takes place, the median resale price for a home in Palo Alto is about $1.6 million. In Round Rock, Texas, it’s about $180,000, except the home and property are bigger.
We hear from HP all the time that a huge deterrent to the ability to recruit and retain people anywhere near Silicon Valley is the housing issue. We don’t hear that from Dell, which is also a member company, about their operations in Round Rock. It does continue to plague us and we will continue to sound the alarm.
I’d like to see how the November 2007 contract issued in November 2006 has anticipated the December ’07 market at the end of each month if anyone knows how to do that. It would give some insight to how it anticipates the actual performance as we approach December 2007.
Seq.
No. Contract
Month Product
Code First
Trade
Date Last
Trade
Date Delete
Date
1 Nov 2007 SFRX7 11/29/06 11/26/07 11/27/07 12/03/07
For SF Index – pretty efficient by the time you get to maturity. Volatility (annualized std dev) for daily returns I had (from Sep 21, 06 and on) was 2.0%, 4.9%, 2.4%, and 2.7% for the Nov 06, Feb 07, May 07, and Aug 07 contracts, respectively.
Nov 06 contract on 9/21/06: 215.4
Nov 06 just before maturity (11/27/06): 216.2
Nov 06 Index value (released 11/28/06): 216.38
Feb 07 contract on 9/21/06: 207.4
Feb 07 just before maturity (2/26/07): 212.6
Feb 07 Index value (released 2/27/07): 212.13
May 07 contract on 9/21/06: 204.8
May 07 just before maturity (5/28/07): 209.8
May 07 Index value (released 5/29/07): 211.09
Aug 07 contract on 9/21/06: 202.6
Aug 07 just before maturity (8/27/07): 210.8
Aug 07 Index value (released 8/28/07): 209.48
Nov 07 contract at contract open (11/29/06): 201.00
Nov 07 contract at 10/10/07: 204.00
Nov 07 Index value (will be released in Nov): TBD
Nov 07 Annual Std Dev of Daily Return: 3.5%
Anyone have access to the latest bid/ask spreads on any (esp SF) of the Nov 11 contracts? They gotta be pretty wide.
Wow! Thanks for sharing that detailed historical information on the CME quotes, Biasfree.
I just came across this blog, and I must say, I am very impressed with the urbane and informative level of the discussion here relative to other real estate comment sections, such as on the SF Chronicle real estate articles I have read. I own/live in a mid-price range condominium in Berkeley. Zillow has my unit in the low $700’s. Anecdotally, the market in Berkeley seems to be holding up well so far from what I can see. Since May we have had two units turnover, and they marketed well and quickly.
I also would be very interested in the bid/ask spread on the CME SF contracts.
At the risk of stating the obvious, have you tried: http://housingrdc.cme.com/?
According to the CME, the Bid (153.4) / Ask (185.6) spread is currently a staggering 32.2 points on the November 2011 San Francisco contract.
Glad you found us. And as always, thank you for “plugging in.”
Interesting! So, it’ll cost me 17% (ignoring leverage) to get in then out. If you assume vol of about 3-4% a year, that’s over four years of vol in the spread alone. With leverage (I believe initial margin requirement is ~$2K per contract, or 4.3% of the ask), trading costs represent 400% of my capital! (A 185.6 index value has a $46.4k notional value at 250 bucks a point).
Of course, I could hold it until the spreads narrow or even to maturity, but as Dude mentioned: one hedge trade could trigger insane margin calls.
As far as valuation, I think a more reasonable estimate of the market’s view on housing returns would not be the 26% decline suggested in the article, but instead be around 18% and be based on the midpoint of the bid/ask (still extremely large based on historical performance).
If I understand correctly, you buy CME based on CS index, and then sell at the end of the contract, right?
For example, I could put $850 to buy a two year contract, and if the CS index is 15% down in two years, I get $850 back. If CS index is the same as today, I get $1000 back. Is that right?
John,
Unfortunately that’s not how the market works. A good starting point for you might be the CME Housing Futures & Options Brochure (PDF). And as we noted above, current quotes are available at housingrdc.cme.com.
Thank you for the info.
The 136 bidding price for SF/Nov 2012 look very tempting 😉