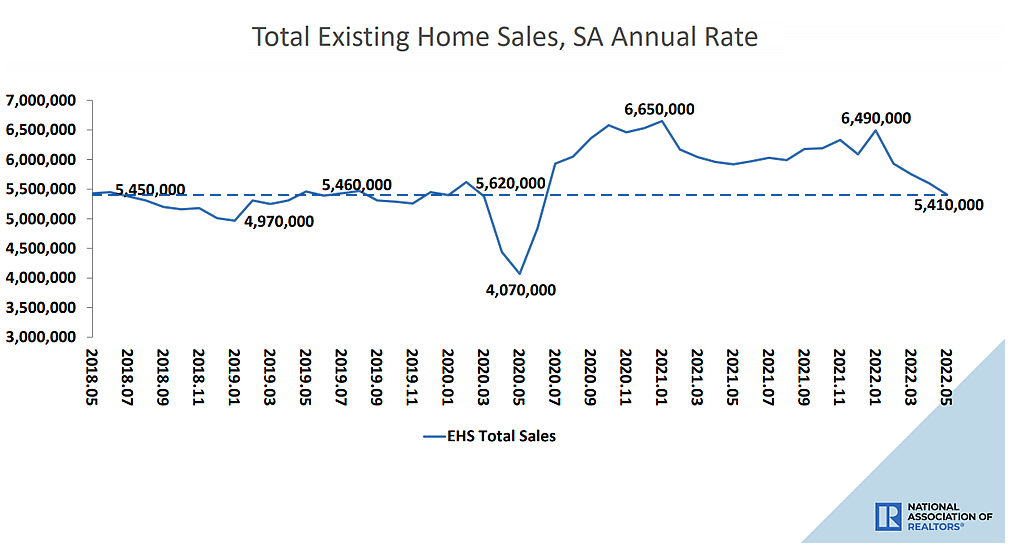
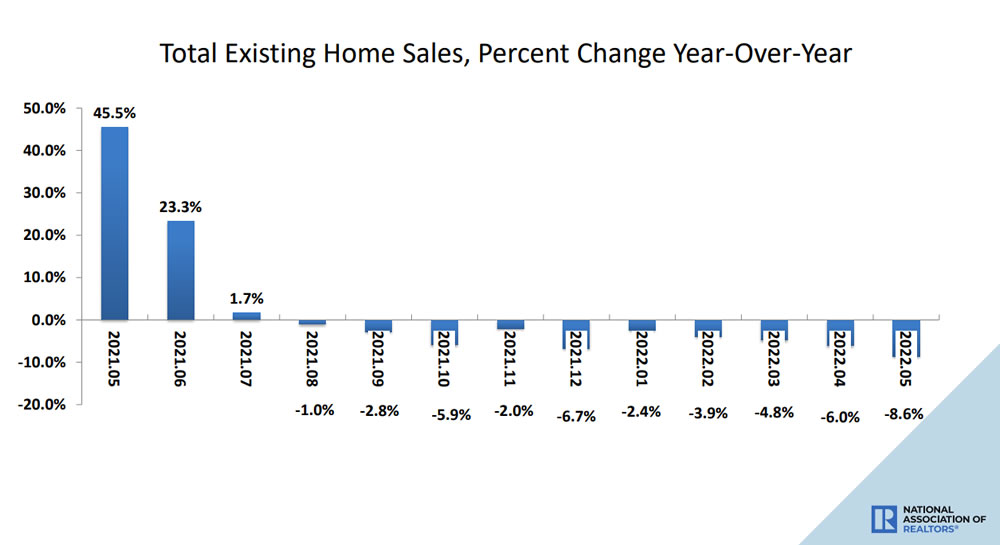
Having dropped 2.4 percent in April, the seasonally adjusted pace of existing-home sales across the U.S. fell another 3.4 percent in May to an annual rate of 5.41 million sales, representing the tenth straight month with a year-over-year decline in sales, the largest year-over-year decline (8.6 percent) since the pandemic hit, and the slowest seasonally adjusted pace of sales since June of 2020, according to data from the National Association of Realtors (NAR).
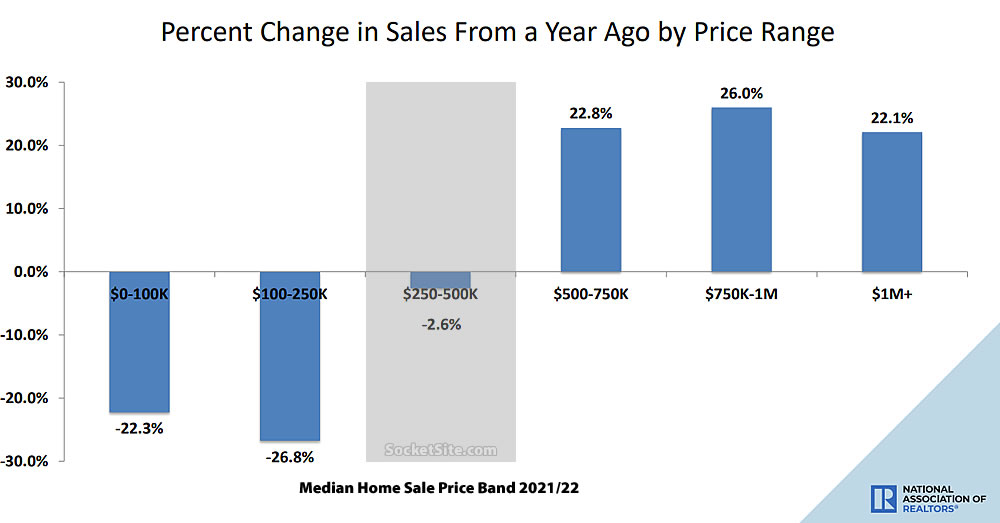
At the same time, the number of existing homes on the market at the end of last month, net of all sales, increased another 12.6 percent and was back to within 5 percent of last year’s levels with the inventory of unsold new homes on the market having climbed to a 13-year high. And while the median existing-home sale price last month was a record $407,600 and 14.8 percent higher than it was at the same time last year, that’s with a dramatic shift in the mix of the homes that have sold, a key point that we really can’t overemphasize, but we’ll try.
Pace of home sales continues to fall [to the fairly consistent sales rate that existed before covid…]
In other words, the pandemic-driven increase in sales didn’t represent a fundamental shift in the market but rather a short-term shock, with demand now dropping, supply on the rise and the cost of leverage having spiked.
I hope no one thought that a virtually unprecedented, one-off market impact such as the pandemic would cause a long-term shift in the market…
Especially if those same non-prognosticators were the ones claiming that the first couple months’ dip in the RE market, at the start of the pandemic, heralded a tectonic shift in the other direction…
You’d be surprised. But if the market was being driven by “a virtually unprecedented, one-off…impact,” that was only temporary, any thoughts as to the implications for the market going forward, particularly with respect to values as demand drops and the market returns to a pre-Covid state?
The decline curve is much sharper in the official data.
And further decline are expected, say the people whose job depends on it.
Be careful, “the official data” to which you linked is for new home sales, not existing. And as we headlined last month and referenced above: Pace of New Home Sales Plunges, Inventory Hits a 12-Year High.
That’s a very short chart – could we see one covering 5-10 years of activity? Might help to show if this is a return to mean or something more significant.
I’m interested to see if any fundamental changes (to zoning, financing, taxation, or otherwise) come out over the next 5-10 years as more and more voters get priced out of the (unfair) housing market.
What’s ‘unfair’ about it? Life is not fair nor unfair.
I’m curious if the change population/demographics resulting from the pandemic will shift SF to the center politically, which would also be more housing friendly. Tough to tell from the last election, as bonds were passed (progressives) but the DA ousted (centrists, and all those who had their home broken into and/or graffiti’d).
would it be more housing friendly? Why?
I feel like at some point we have to retire the “a dramatic shift in the mix of the homes that have sold” line (much like “transitory inflation”). If home values/prices have actually gone up, it’s going to look like a huge shift in the mix when it’s just higher prices – showing a mix shift does not disprove higher prices. Instead, I would prefer this to be tracked by the size of home sold, or price per square foot adjusted for inflation.