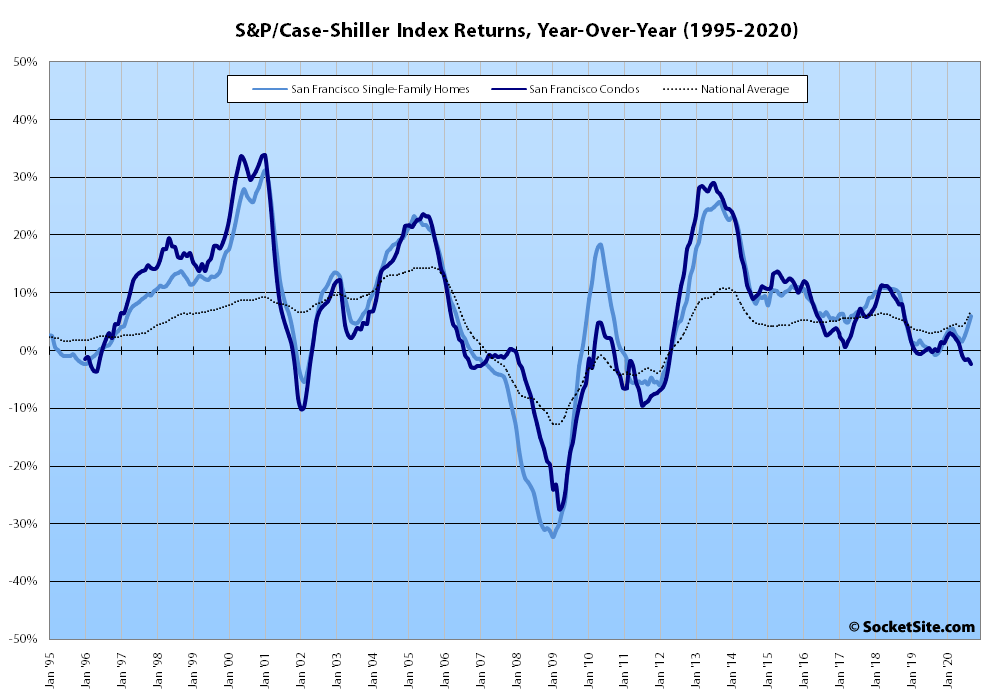
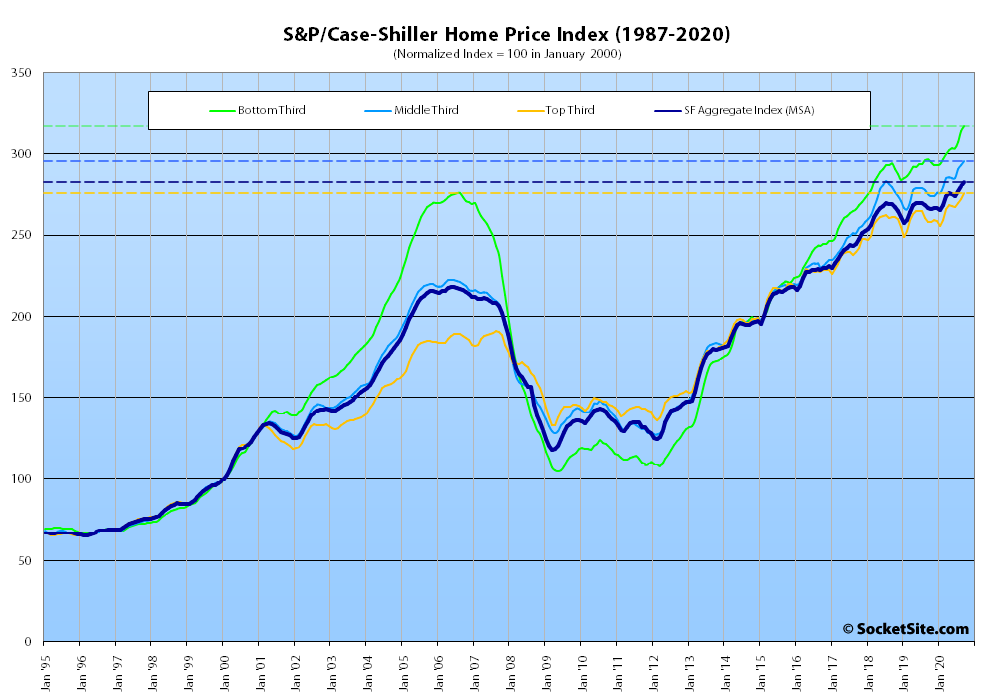
Having inched up an upwardly revised 0.9 percent in August, the S&P CoreLogic Case-Shiller Index for single-family home values within the San Francisco Metropolitan Area – which includes the East Bay, North Bay and Peninsula – ticked up 1.0 percent in September for a year-over-gain of 6.0 percent in the local index.
At a more granular level, the index for the least expensive third of the market ticked up 1.0 percent for a year-over-year gain of 6.8 percent; the index for the middle third of the market inched up 0.8 percent for a year-over-year gain of 7.5 percent; and the index for the top third of the market ticked up 1.2 percent in September and is now 6.8 percent above its mark at the same time last year.
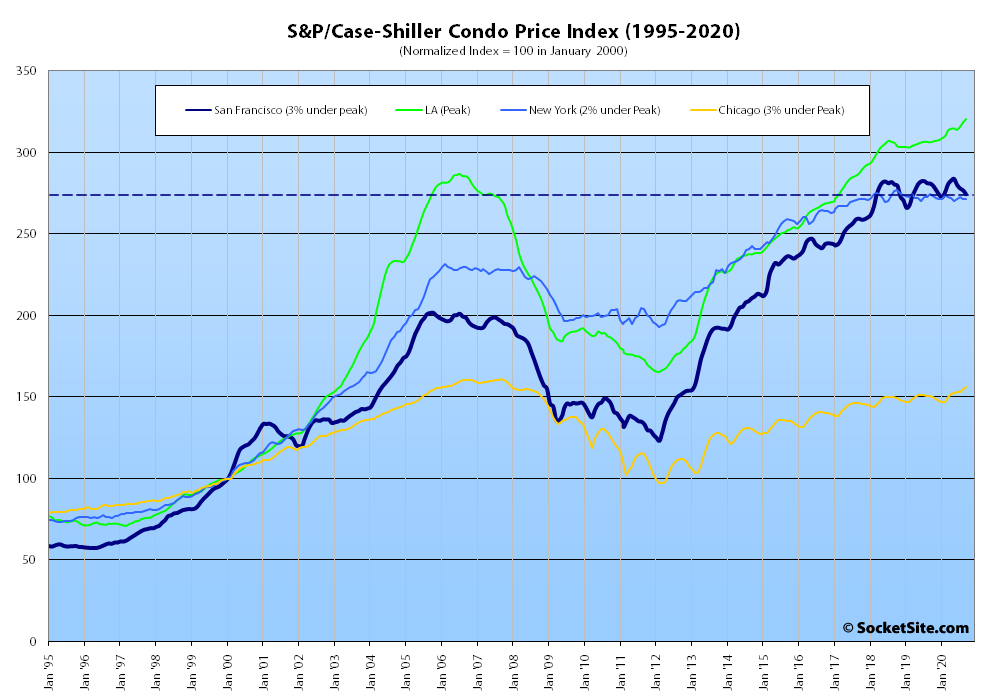
At the same time, the index for Bay Area condo values, which remains a leading indicator for the market at a whole, inched down another 0.9 percent in September and is now down 2.3 percent on a year-over-year basis, versus gains in Los Angeles, Chicago and Boston, with the index for condos in New York having inched up 0.1 percent in September but now down 1.1 percent, year-over-year.
And nationally, Phoenix still leads the way in terms of indexed home price gains (up 11.4 percent on a year-over-year basis), followed by Seattle (up 10.1 percent) and San Diego (up 9.5 percent) with an average gain of 7.0 percent nationwide and New York registering the lowest indexed gain at 4.3 percent, year-over-year.
Our standard SocketSite S&P/Case-Shiller footnote: The S&P/Case-Shiller home price indices include San Francisco, San Mateo, Marin, Contra Costa and Alameda in the “San Francisco” index (i.e., greater MSA) and are imperfect in factoring out changes in property values due to improvements versus


Let’s not bury the lede… S&P CoreLogic Case-Shiller HPI for Ess Eff hit an all time high.
^ This. Nobody on here wants to talk about how the SF market is continuing on at all time high levels during the pandemic. Instead they wish to talk about mythic precipitous falls which have not happened, but are a given. Puts a whole new spin on “this time it’s different.” heh. And as to condos remaining a leading indicator, that begs a question or two as well. How long are they a leading indicator before they are not so? It’s going on 3 quarters now. Again, I’d point to what larger condo buildings are, and how they function in a pandemic, as being the only “it’s different this time” thing going.
That’s like going into a retirement/convalescent home and saying “Nobody wants to talk about COVID’s 99% survival rate” While technically true, its very misleading to the sub group you are addressing.
Case-Shiller is an average of the entire bay area. From all appearances we are seeing two distinctly different trends going on in SF city vs other cleaner/greener parts of the bay. Look at housing inventory in SF vs nationally.
The last SFH apple here on the Noe/Eureka border was down 2.3% from 2015 even with remodels and upgrades. Adding to a long list of 2015 era pricing. Condos did lead. Back a while it was only condos falling to 2015 pricing. Someone just posted a condo that slipped below 2003 pricing, a loss on a 17 year hold (OP made a typo I think)! If that’s a leading indicator, it’s going to be quite a wild ride!
Your analogy is a malapropism, because “technically true” is the only thing that matters here. Comparing it to covid survival rates was a flaming troll of a take. Come on. Anyway, I share SF SFR numbers all the time on here.It’s been this way for 7 months now. Also, if you want to break down where SF SFRs stops and CS top tier beings, go for it. But before you spend that time you might know they’re generally similar. Then you’re on about a singular apple and a singular condo as being leading. That’s not a take you can back up.
Pretty rude. Pretty poorly reasoned, really. Think what you want all right? What do I care.
“The last SFH apple here…”, yeah not the last apple, just the last one on here. And I am sure there are many many 2003 and later SFH apples in Noe that would show that condo is not a leading indicator.