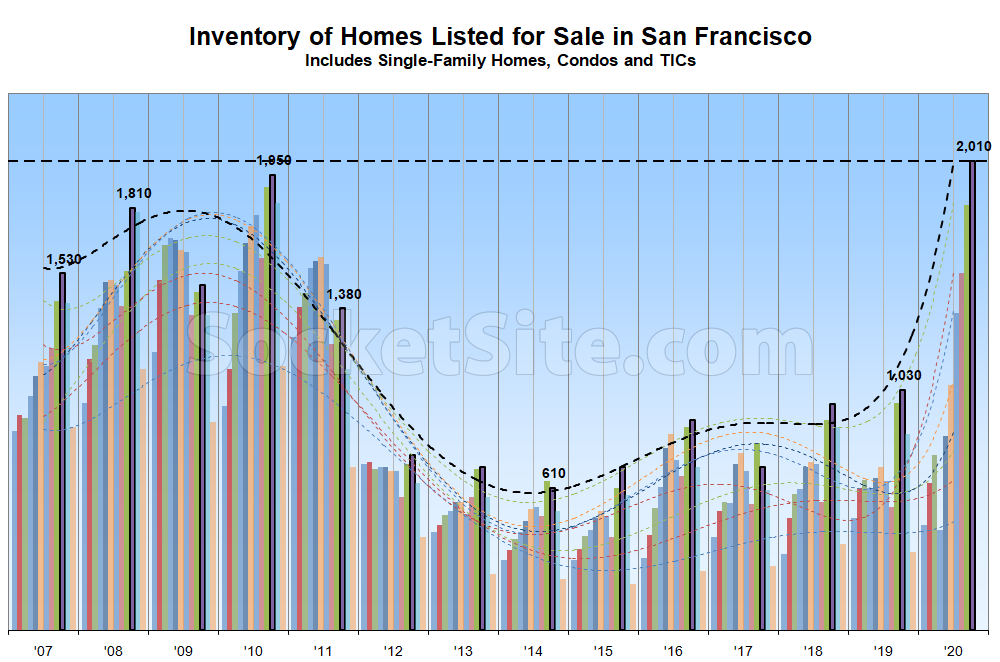
Following a trend which shouldn’t have caught any plugged-in readers by surprise, as its basis was in place prior to the pandemic having hit, the number of homes on the market in San Francisco, net of all sales, both pending and closed, has just ticked over 2,000 for the first time in over two decades.
In fact, listed inventory levels in San Francisco are now 94 percent higher than at the same time last year (versus nearly 20 percent lower nationwide), over 200 percent higher than they were in October of 2015, and around 20 percent higher, on average, than during the Great Recession, with the number of condos on the market (1,500) now up 120 percent on a year-over-year basis and single-family home inventory (510) up 42 percent to a 9-year high (and climbing).
At the same time, with 33 percent of the homes on the market in San Francisco having been reduced at least once, which is 10 percentage points higher than at the same time last year, the number of reduced listings has jumped over 40 percent since early September to a 10-year high in the absolute, which has driven the average list price per square foot down.
All that being said, keep in mind that listed inventory levels typically peak in October, at which point new listing activity typically slows and unsold homes are more likely to be withdrawn from the market (and then re-listed anew in the spring).
We’ll keep you posted and plugged-in.
If you HAVE to sell now, it really sucks….but if you are in a position to buy, it sounds pretty good….
I bet if you were in Amsterdam during the tulip mania you’d think it was a buying opportunity when tulips only cost as much as a mansion…
Well, of the 4 properties that I currently have in the city, 2 were purchased on short sale, 1 on foreclosure, only 1 was a normal purchase…. So that should tell you what kind of market condition I am excited about… 🙂
Curious, what is your day job, or have you always been a real estate investor?
I am a finance major, with a master degree in finance, work in corporate finance at various tech companies for the past 15 years….Currently at a mid level, not high up.. 🙂
Bought all these properties along the way using my savings from my w-2….Every purchase was a slight negative cash flow at the beginning, turning into positive CF after 3-5 years….:-)
Per your cash flows… I am in a similar level career wise & have excess savings for investment, but instead of buying physical RE besides my own home, I decided to buy REIT’s and Preffered ETF for the cash flow (dividends), logic being I might be getting a bit of a smaller return but I have zero headache in terms of managing the property vs owing passive ETF’s with diversified risk. There are other considerations too of course, but that was my primary one.
But out of curiosity what is your cash flow % / ROI relative to your investments? And roughly how much time do you spend managing it? I’m just curious the return differential of better return % with physical RE but having to manage the properties, vs a bit less return on holding a diversified REIT or preferred ETF’s. I always assumed I was getting less but never really knew how much, so your comparison would be interesting.
OK, I can provide a high level idea without spending time to look up my spreadsheets, is that fair?
So my purchases in the city are between $600K to $700K… Back in 2009, that kind of money bought you 2/2 in Pacific Height and Russian Hill, but you have to OK with pink tubs and beige carpets…I was renting $2900 at the time, and would be losing like $500 per month per property…Fast forward to now, these are $1.4M ish property renting $4500…So today, between the 4 properties in the city, I am looking at $4.5M value with $1.6M mortgage… $180K in gross rent and $50K in net rental income (after all expenses including principle paydown)…..
Make sense?
Cash flows of 6% – 10% are available in the greater Cincinnati area. Varies depending on LTVs. Those cash flows include management fees and all other expenses. Homes from 100K – 350K. With the higher end of the range in Class A and B neighborhoods. Short sales and foreclosures aren’t for everyone. I wanted to purchase more RE but could not do it in the BA and make a immediate good ROI. Out of state rentals aren’t for everyone but it has been seamless for me – I own 9 rentals. So, if you are ever tempted to do brick and mortar RE investing in addition to REITs, consider out of state markets in addition to foreclosures/shorts in the BA.
It seems like mixed messaging here. I’d agree that when foreclosures and short sales are piling up it will probably be a great time to buy. But looking now seems very premature.
Look at the slope of the inventory rise vs that of the last cycle. And we’ve already surpassed the inventory peak of the last cycle. It also looks as if there is a great deal o pent up financial distress coming down the pipe when the stimulus winds down.
It seems likely to me that we will eventually surpass the foreclosure peak from last cycle. At that point I think it will be a pretty good time to buy.
It will be interesting. I think borrowers will be afforded much stronger protections (forbearance) compared to the last recession.
Certainly there is currently a great deal of formal and informal (banks simply not filing default notices) forbearance. But this just kicks the can down the road. I don’t think they will keep up the forbearance forever and meanwhile this just piles payments onto the loan balance.
I don’t think that bailing out over-levered coastal homeowners/investors is going to be politically popular with either party regardless of who wins the election.
The loan balance is much smaller measured in 2020 dollars than it was in 2019 dollars.
This is an atypical year. I don’t think we will see as many homes being withdrawn from the market. My belief is that inventory will continue to creep up.
if you read todays chronicle article, you would think the real estate market was booming
Yeah I did read that article. Even the part about SF sounded like it was booming.
Separately, I’ve always wondered if the ads for real estate disguised as articles in sfgate are paid for or not.
SFH still getting multiple bids and way over asking prices.
And yet, the average single-family home (SFH) price is down around 8 percent over the past six months and down 9 percent on a price per square foot basis.
But it’s true, homes that have been listed with below market pricing still tend to generate “multiple offers” and “over asking” sale prices (which are relatively meaningless, but oft marketed, stats).
How accurate is the price per square foot metric for SFH? Depending on whether some space is permitted or if it’s included in the MLS listing, seems like the ‘actual’ space can be hard to conclude. Still, a 9% decrease in price per square foot sounds dramatic.
Price per sq.ft. is just as accurate as it was 6 months, a year, 3 years, etc. ago. Yes, there are inaccuracies in posted living space but those errors affect all samples roughly the same way.
I have not seen any data suggesting prices are down from 6 months ago. It seems like all are suggesting increase of 2-3% yoy for SFH. Can you share your stats and source data?
The stats are based on a query of all MLS reported transactions, comparing sales over the past six months versus the six before.
Incorrect on the topic of SFRS. Querying the MLS for SFRS D1-10, I get 1101 sales 4/23/20 to today @ $1014/ft. The previous six months, 10/21/19 – 4/22/20 yields 927 sales @ $1008/ft. So we see there that SFRs are up in both volume and $/ft viewing 6mo/6m.
We’re tracking over 1,200 closed sales over the past six months, with an average, not median, sale price per square foot that has dropped under $1,000 per foot.
But the sales volume is up, as is to be expected when comparing total sales in the second and third quarters versus the fourth and first.
You said MLS reported transactions, and the topic was SFRs. The statistics were as I’ve stated for 6mo/6mo for volume and average $/ft. You are not seeing or getting differing MLS statistics for San Francisco D1 – D10.
We can’t account for your queries or the discrepancy. But once again, we’re tracking over 1,200 closed single-family home sales over the past six months, not 1,100, with an average sale price per square foot that has dropped under $1,000 per foot.
The SFARMLS literally defaults to precisely 6 months from today when it comes to sales data. So, take that one, D1- D10, and then do a subsequent one of the previous 6 months, to the day. It’s a query of a database. I’m not certain what the word “tracking” has to with anything, other than to imply it is you who uses other data than merely the MLS, as was stated.
Once again, we can’t account for your queries or the transactions you seem to be missing.
It’s not arguable. I welcome anyone else to take this up moving forward. yawn
Nonsense. The real estate market is strong! Sure, the seller of 1548 Jones lost $100,000+ on their 2014 purchase, but 246 2nd St. #1103, in SOMA, btw, just had a $100K payday — on their 2005 purchase. Of course, if prices fall another 10%, even that will be wiped out, but that hasn’t happened yet! All profits and losses after fees and taxes.
$100K payday? After paying HOA, taxes, insurance, and interest for 5 years? Sounds like a bond with negative returns if you ask me.
Tipster – Are you referencing unit 1103 or 1003 at 246 2nd? My wife and I bought 1003 in 2009 for $670,500 from the bank and just closed last week on the sale at $1,150,000.
As expected: Number of Homes for Sale in S.F. Has Likely Peaked for the Year