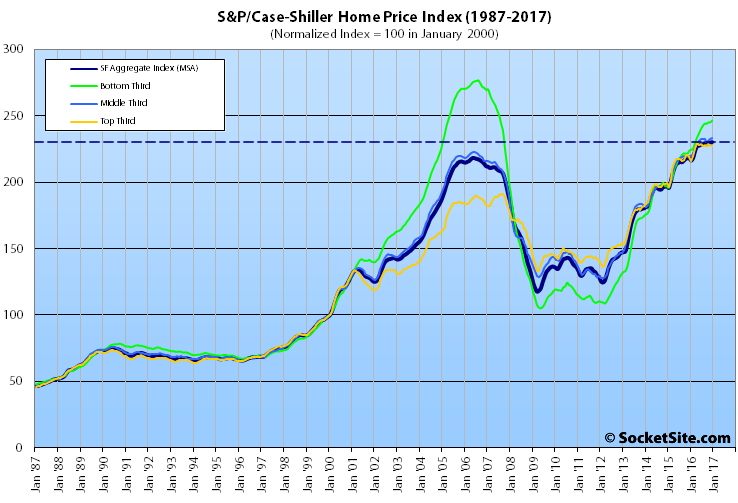
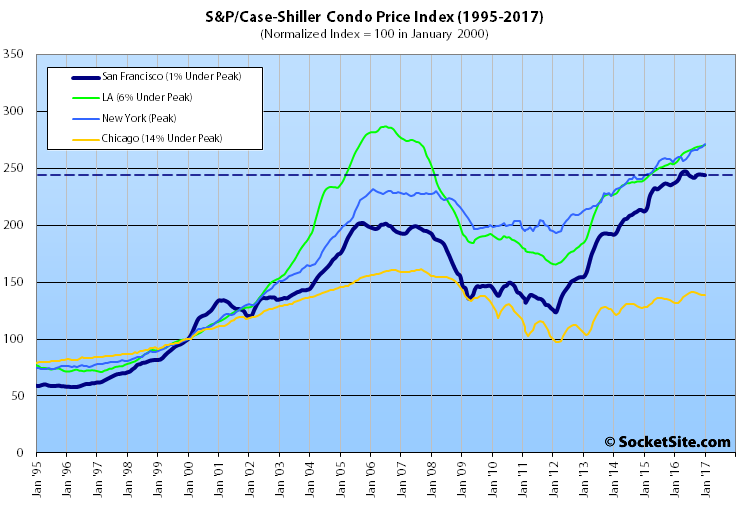
Having slipped 0.1 percent in November, the S&P CoreLogic Case-Shiller Index for single-family home values within the San Francisco Metropolitan Area – which includes the East Bay, North Bay and Peninsula – inched back up 0.1 percent in December to an all-time high while the index for Bay Area condo values slipped.
At the same time, the national index for single-family home values in the U.S. inched up 0.2 percent and is running 5.8 percent higher on a year-over-year basis, a 30-month high.
The aggregate index for single-family Bay Area homes is now running 5.7 percent higher on a year-over-year basis, which is down from a 10.3 percent year-over-year gain at the same time last year and an average of 7.0 percent over the past twelve months with some weakness at the top.
And while the index for the bottom and middle thirds of the market ticked up 0.5 percent in December, for year-over-year gains of 10.0 percent and 6.2 percent respectively, the index for the top third of the market slipped 0.3 percent for the second month in a row and its 3.9 percent year-over-year gain is the second smallest since mid-2012.
That being said, the index for the top third of the market remains 18.9 percent above its 2007-era peak while the index for the bottom third of the market is still 10.9 percent below its peak in 2006.
The index for Bay Area condo values slipped 0.2 percent in December but remains 3.2 percent higher versus the same time last year and 20.8 percent above its previous cycle peak in October 2005.
And for the tenth month in a row, Seattle, Portland and Denver have reported the highest year-over-year gains in the index for single-family homes, up 10.8 percent, 10.0 percent and 8.9 percent respectively.
Our standard SocketSite S&P/Case-Shiller footnote: The S&P/Case-Shiller home price indices include San Francisco, San Mateo, Marin, Contra Costa and Alameda in the “San Francisco” index (i.e., greater MSA) and are imperfect in factoring out changes in property values due to improvements versus appreciation (although they try their best).


More record highs for houses through December. With the stock market up about 5% since the beginning of the year, the economy still humming, and interest rates down a little bit since then, I wouldn’t expect any bargains any time soon. Tough time to be a buyer, and still a very good time to be a seller.
At the same time, recorded home sales in San Francisco proper dropped 15 percent in January despite an increase in inventory, new condo sales hit a multi-year low despite a significant drop in pricing, and rents have dropped back to 2014 levels and continue to trend down.
That’s the point. Despite those selective observations, prices continue to hold firm, and even rise to new record levels for houses.
Those so-called “selective observations” are the sales, pricing and rents for San Francisco proper. The index above, upon which you seem to be hanging your hat, includes the East Bay, North Bay and Peninsula in its mix and has been getting a recent boost from the relative performance of (formerly) lower-cost areas.
Not really. You’re pointing to “pricing” in terms of medians, which the very post to which you link describes as follows: “Keep in mind that while movements in the median sale price are a great measure of what’s selling, they’re not necessarily a great measure of appreciation or changes in value and are susceptible to changes in mix, as opposed to movements in the Case-Shiller Index.” This thread, where I was commenting, discussed precisely that index.
You also omit MLS sales data, which is available at very granular levels to indicate $/sf, medians, averages, months of inventory, etc. You also refer to “black box” analyses of rents and new condo sales based on nothing transparent at all. Don’t get me wrong. All information on the market is useful. But let’s not pretend we can selectively point to certain information to the exclusion of others and then draw grand conclusions.
Do you really think SF has underperformed the outlying regions in the Case Shiller numbers? Based on what? I’m not saying it’s impossible, but you have to have some basis if you’re going to state that.
Our reference to pricing isn’t based on medians. Self-reported MLS data is a subset of the recorded data (which is better measure of activity). Condo sales are based on data we pull from industry report. And you’re welcome to run your own analyses with respect to rents and prove us wrong.
San Francisco proper has, in fact, recently underperformed outlying areas in terms of relative appreciation and sales. The very first chart above and the tiered results should provide a hint, as should the relative performance of the counties.
Anon has a point. SocketSite has adopted a narrative that real estate prices are falling, despite a mixed bag of evidence. While condo prices are down, SFH house prices are stable or growing (for the lower tier in SF). Also, employment figures and macro drivers of real estate prices (interest rates, GDP growth, stock prices) continue to be very strong. The continuous appreciation of prices in the East Bay and North Bay is a sign of the Bay Area’s strong, high-wage job market. SF and the Peninsula remain the drivers of it.
To be fair, there is not right or wrong on this issue. I also believe the editors report in good faith. I just wish they would not stick to a set narrative, but acknowledge that evidence is more mixed.
Our apologies, next time we’ll note the index for single-family home values within the San Francisco Metropolitan Area “inched back up 0.1 percent in December to an all-time high” in the first sentence of our report and highlight “House Values Inch Up” in our headline.
Our narrative is based on a holistic view of the data and trends, not emotional platitudes nor a single metric.
“While condo prices are down, SFH house prices are stable or growing (for the lower tier in SF)”
The Case Shiller low tier for the SF MSA is for properties under about $620k. So how relevant do you think that is for SFHs in SF proper? i.e. How many SFH’s in SF have you seen for under $620k recently?
Be careful. The Case-Shiller tiers are based on the previous purchase price of the properties which recently sold, not their current values.
RE cycles are slow. At this point you’re just looking for the turning point from up to flat. Even in the last massive boom-bust cycle the market kicked around for 2-3 years at the top before the serious downturn began.
How do I know about bottom tier SF SFH appreciation?
1) Go on Redfin
2) download SFH sales prices for zips 94134, 94112, 94124 (aka the South Eastern hoods of the city)
3) Compare median sales prices for 2014, 2015 and 2016.
4) You tell me if prices stagnated or appreciated in 2016
But a change in median doesn’t represent appreciation since it’s not tracking the resale of the same homes.
If a flipper buys a house for $800k, puts $1M into it and then re-sells it for $1.6M, that pushes up the median, but there’s been no appreciation.
The key take away, beyond how sub-markets in the Bay Area are doing relative to one another, is that Bay Area homes prices are essentially appreciating at the national average rate. That is a huge change which has been a long time in coming.
Added to that are markets like Seattle, Portland and Denver, the three mentioned here, that are significantly outperforming the Bay Area. Other markets Forbes recently listed as best for RE investment were Atlanta, Jacksonville, El Paso Raleigh and Charlotte all of which are appreciating at close to Seattle numbers and are expected to continue doing so in 2017.
Given that investment (foreign and corporate) in Bay Area RE has been partly responsible for the price surge of recent years, as some of that investment leaves the Bay Area for other more lucrative markets the region is likely to see more downward pressure on prices.
fair enough