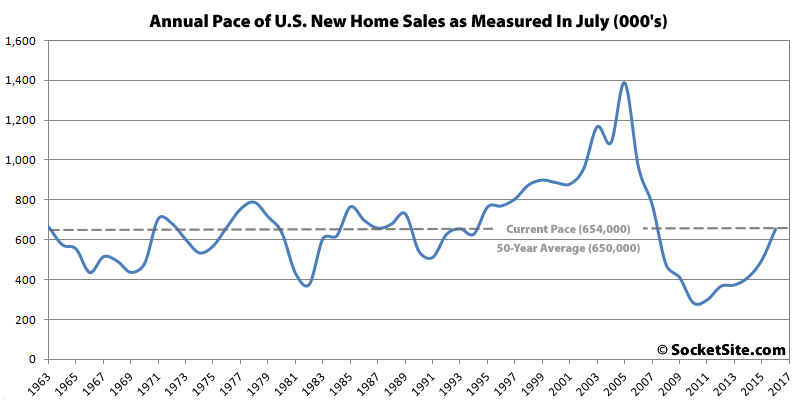
The pace of new single-family home sales in the U.S. jumped 12.4 percent from a downwardly revised annual rate of 582,000 sales in June to an annual rate of 654,000 sales in July, which is 31.3 percent higher than the rate of sales at same time last year (498,000) and the fastest pace since January of 2008.
And while the current pace of sales is roughly half the record-high rate for this time of the year (1,389,000), as set in July of 2005, it’s above its long-term average (650,000) for the first time since 2007, albeit by 0.6 percent.
In terms of inventory, the number of new single-family homes for sale across the county is now 233,000, down 2.9 percent from the month before but 8.4 percent higher versus the same time last year.
The downwardly revised pace of new single-family home sales in the West (137,000) was unchanged from June to July but remains 11.4 percent higher versus the same time last year.

I realize this is a national statistic which has little relevance to the SF Bay Area market, but it’s a very important symbolic milestone. Boy that was a long long hangover from the Great Recession.
This is a very good sign for the broader economy. New house sales typically lead us out of a recession as money flows into construction, new appliances, etc. But the Great Recession was caused by housing, with way too much having been built in the preceding years, and thus there was not much new housing to help prime the pump. So it is good news indeed to have recovered from that very long hangover.
Wonderful news. What’s good for the country is good for SF.
Sorry to burst your bubble once again folks (no pun intended). What we’re seeing here is lots of mom and pop landlords motivated by desperation for retirement yield are snatching up rentals to take advantage of the Fed driven stagflation. At the same time, the institutional landlords like Blackrock are liquidating the properties they picked up after the last bust. Also, lots of young couples in second and third tier markets are finding it’s now cheaper to buy than rent, and they’re taking advantage of 3% down loans. Lots of them have low paying service jobs too. Behold the new bag holders.
I almost hate to engage, but most of what you’re talking about doesn’t even have anything to do with new home construction. No bubble to burst…we’re up to “normal”, and that’s a good thing….a mark that there is actually demand for new homes after years of foreclosures and shortsales dominating the market. We got there the old fashioned way…demographics. Millenials forming households and they need to live somewhere. More people have jobs. Incomes are finally FINALLY going up. Gosh, Sabbie, you need a new outlook on life.
I know, I know, nobody likes a party pooper! But I’m trying to help you guys out. The MSM has hundreds of articles about how this housing market is so freaking awesome, but not so many cautionary ones. And I’m not even getting any money for these clicks! Come on, we are seven years into the recovery, 35% up on the Case Shiller already, do you really think these are “green shoots” or more like “last gasp” for this cycle? Anyways here’s great article that I read this evening which presents the bear case.
I have a dream that one day socketsite will identify and link back to its data sources.
[Editor’s Note: In this case, it’s data we compiled from U.S. Census Bureau and Department of Housing and Urban Development reports. Feel free to give them a call.]
and by “compiled” you mean, you clicked here?
was that so hard?
[Editor’s Note: That’s fantastic! We’ll let you run the reports, track the averages and summarize the results (for some reason we can’t find the buttons to actually compile the data) from now on!]
and by “summarize” you mean rewrite the press release “Sales of new single-family houses in July 2016 were at a seasonally adjusted annual rate of 654,000, according to estimates released jointly today by the U.S. Census Bureau and the Department of Housing and Urban Development. This is 12.4 percent (±12.7%)* above the revised June rate of 582,000 and is 31.3 percent (±19.9%) above the July 2015 estimate of 498,000.” as “The pace of new single-family home sales in the U.S. jumped 12.4 percent from a downwardly revised annual rate of 582,000 sales in June to an annual rate of 654,000 sales in July, which is 31.3 percent higher than the rate of sales at same time last year (498,000) and the fastest pace since January of 2008.”?
[Editor’s Note: Considering we’re working from the same data set, we’d be more concerned if our first sentence was substantially different, not the same as the government’s (although it looks like they missed the context with how the pace compares historically). And our next three paragraphs?]