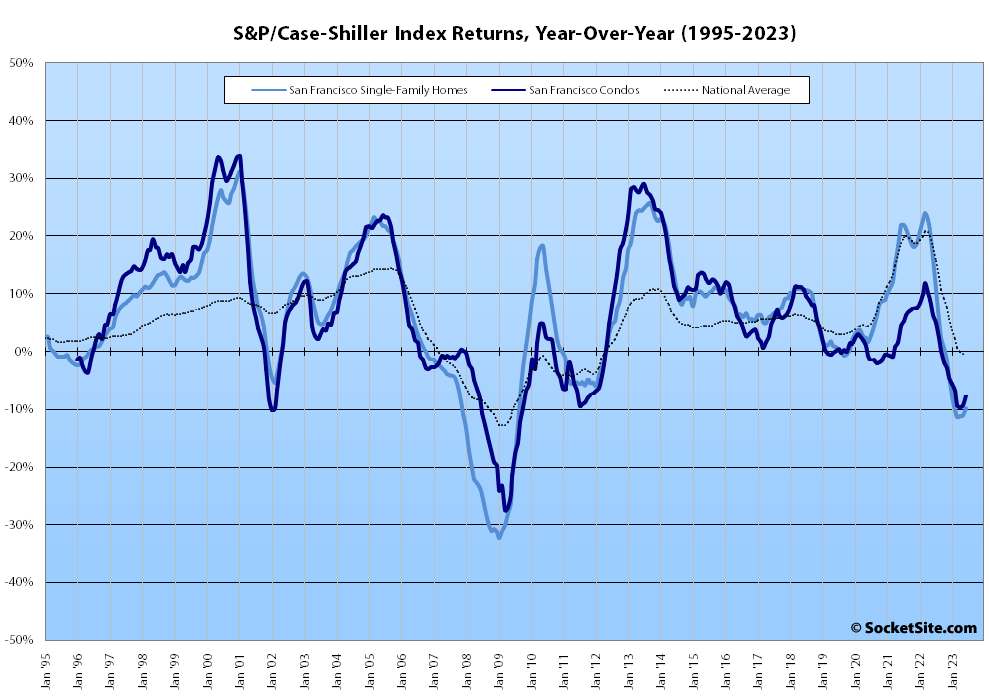
Having ticked up a percent in May, the S&P CoreLogic Case-Shiller Index for single-family home values within the San Francisco Metropolitan Area – which includes the East Bay, North Bay and Peninsula – inched up 0.1 percent in June, but the “San Francisco” index was still down 9.7 percent on a year-over-year basis and 10.9 percent below last year’s peak.
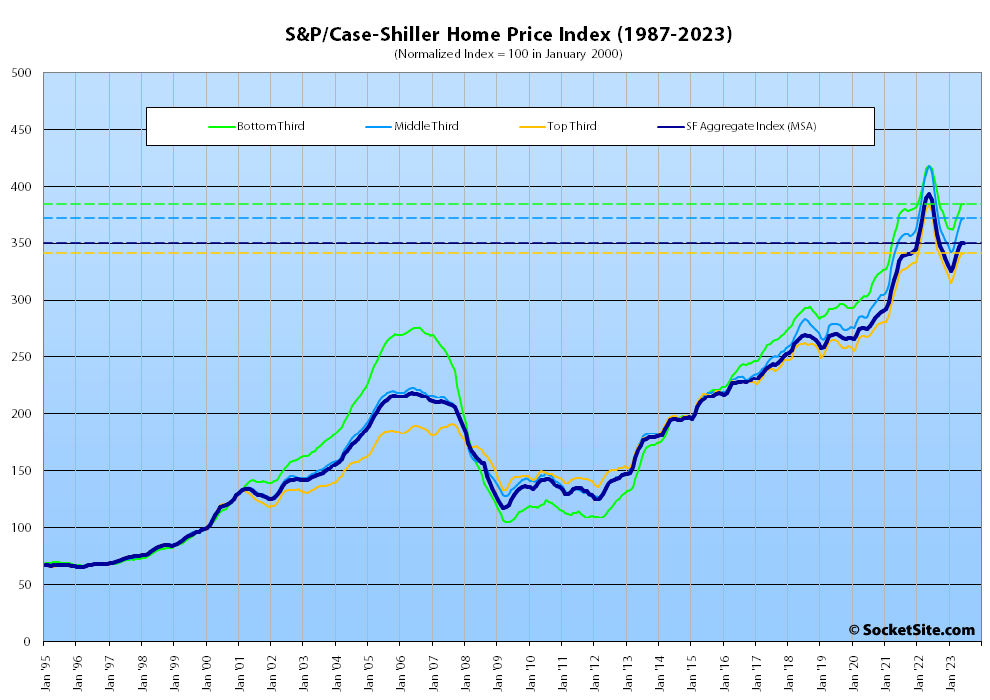
At a more granular level, the index for the least expensive third of the Bay Area market inched up 0.1 percent in June for a year-over-year decline of 7.4 percent; the index for the middle tier of the market inched up 0.5 percent for a year-over-year decline of 9.7 percent; and the index for the top third of the market inched up 0.1 percent for a year-over-year decline of 9.8 percent.
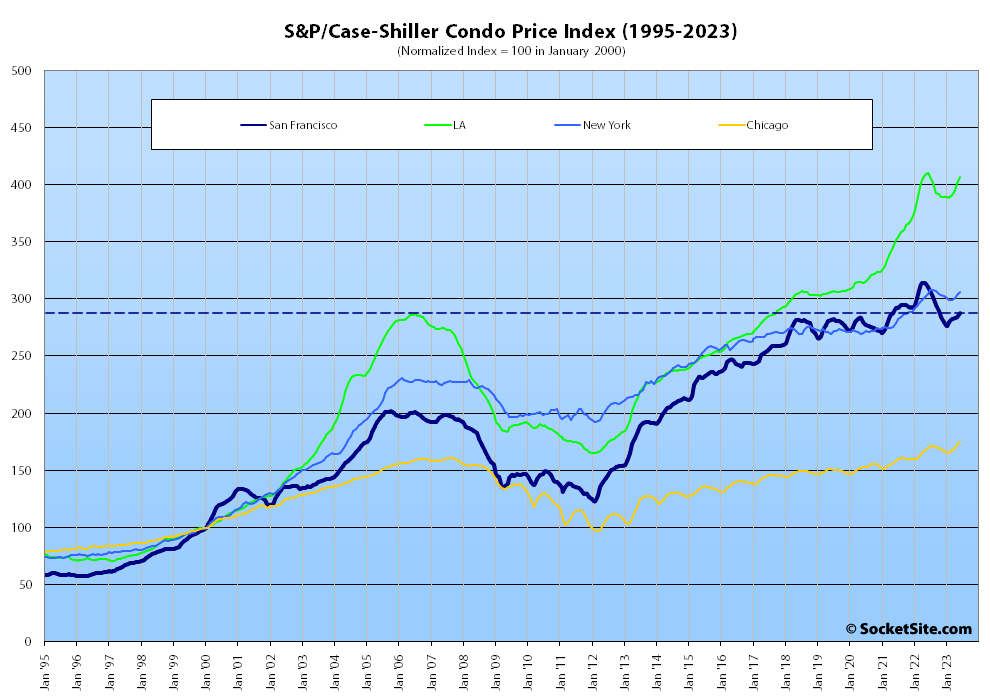
At the same time, the index for Bay Area condo values, which remains a leading indicator for the market as a whole, ticked up a (1) percent in June but was still down 7.5 percent on a year-over-year basis, with a 0.7 percent year-over-year decline for Los Angeles and a 0.4 percent year-over-year gain for New York.
And while the national home price index nearly ticked up a percent from May to June it was unchanged on a year-over-year basis, marking the third straight month without a year-over-year gain, but with Chicago up 4.2 percent, followed by Cleveland (up 4.1 percent) and New York (up 3.4 percent), versus the 9.7 percent decline for San Francisco, an 8.8 percent year-over-year decline for Seattle, and the average rate for a benchmark 30-year mortgage having ticked up, not down, 8 percent since.
Our standard SocketSite S&P/Case-Shiller footnote: The S&P/Case-Shiller home price indices include San Francisco, San Mateo, Marin, Contra Costa and Alameda in the “San Francisco” index (i.e., greater MSA) and are imperfect in factoring out changes in property values due to improvements versus appreciation (although they try their best).