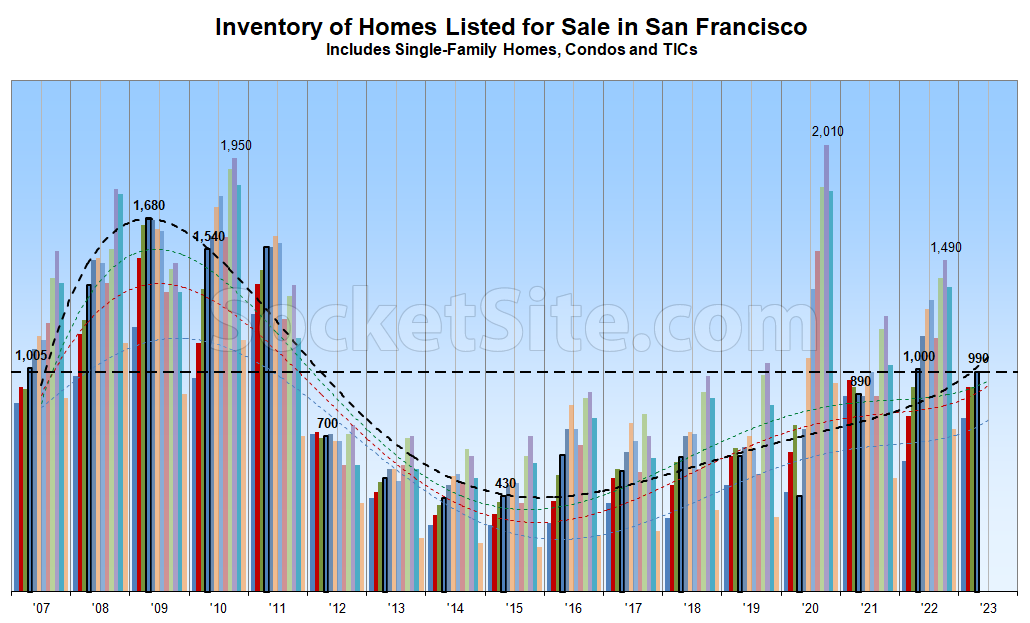
Having atypically ticked down earlier this month, the net number of single-family homes and condos on the market in San Francisco has since started to tick back up, driven by an increase in new listing activity along with a decline in sales.
As such, listed inventory levels are now effectively even versus the same time last year but trending higher, with 50 percent more single-family homes on the market than there were are the same time last year and prior to the pandemic; the most single-family homes on the market, for this time of the year, since 2012; and 50 percent more inventory overall than average over the past ten years.
At the same time, the pace of home sales in San Francisco is down 45 percent, year-over-year, and 20 percent below pre-pandemic levels while the average asking price for a home in San Francisco just slipped back under $1,000 a square foot, which is down around 10 percent from peak but still 5 percent above the average asking price per square foot of the homes which are actually in contract. We’ll keep you posted and plugged-in.
Any chance we could see this graph for just new listings?
A SFH graph showing the 50% yoy increase in inventory would be much appreciated. That is a stark jump from just last week when it was quoted to be a ~26% yoy increase for SFH inventory only. Thanks!
Blah blah. More misleading charts and statistics from sucketsite
The number of units that have been built during the period of this chart make the relative percentage of homes for sale in the city look much different than what you’re showing here. Absolute numbers while the denominator of homes changes drastically makes this chart useless.
Sick burn, dude!
Unfortunately, it’s the ratio of buyers to sellers that really matters, not the percentage of homes. And as we track true inventory levels, which takes into account both supply (listings) and demand (contracts), this chart and the underlying data is not only useful but key.
And yeah, they’ve just been pumping out those new single-family homes in San Francisco, which is obviously why those inventory levels have jumped, not that sales are down.
Is this chart for single-family homes or single-family homes and condos? Both this response and the report summary are confusing.
Sparky, did you read the subheading on the chart shown above itself? Right below the title. I think that would answer your question and clear up your confusion.
I did as well as the 1st paragraph (notes both) then the second paragraph (on saying SFH). What I was responding to was the editor right above me saying SFH and how the city hasn’t been building those in retort to a comment saying the total units are much higher across the chart timeline.
I find that confusing
I assume that the editor’s point is that if there is a sub-segment of the overall SF market, such as SFHs, where total units have not significantly increased and yet the inventory rise in that sub-segment is in line with that of the overall market, then that points to an increase in total inventory not being much of a relevant factor.
As a thought experiment, say I snapped my fingers and added 50,000 occupied units to the SF market right now. How do you think that would change the pricing dynamics for buyers and sellers in the market? Still the same number of active lookers out there, still the same number of homes for sale. If anything that just adds to potential future inventory as any of those 50,000 people may choose to leave SF.
And looking empirically, there has been significantly more condo construction vs SFH construction during the chart period. So if you used Wiseguy’s suggestion and scaled by total units it would make condo inventory relative to total units look smaller. But condos are taking much larger price hits right now vs SFHs. So what’s the point of this Wiseguy metric if it correlates even less with actual empirical price results in the market? i.e. Why create a metric that makes the condo market look healthier then SFHs when in fact the condo market appears to be doing far worse then SFHs?
I’m looking at 283 single family homes for sale in SF. Eleven of those have a 2nd unit or an ADU. Ten of the 283 have a tenant residing in the home. There’s no overlap between the 2-units or the tenant ones, at a glance. So that leaves 262 true SFRs for sale in SF, well on the MLS, anyway. So in terms of the MLS and the aggregators like Redfin or Zillow, i.e., the inventory buyers are looking at by and large, that can’t be anything but a smallish historical number.
Actually, that would be “50 percent more single-family homes on the market than there were are the same time last year and prior to the pandemic [and] the most single-family homes on the market, for this time of the year, since 2012,” as outlined above.
Well, I’d need to see single family homes broken out year over year. You link to yourself linking to yourself linking to yourself linking to a mix of condos, TICs, and SFRs. Meanwhile I know what I know. And that is more like 400s and 500s is a lot of inventory. Not 262- 283.
We link to ourselves because we actually have the historic data, including for single-family homes, which obviously you don’t. But at least you’re not simply misrepresenting the data this time around. Which brings us back to the actual data, trends and market at hand…
Your link there is only you referencing your own unsupported opinion, and off topic. Again, not a real take dude. And you say you’ve got the data, but you don’t show it. Why not? This is not a particularly large SFR inventory and you can’t show that it is.
You can throw a little fit, but our aggregate chart and underlying data isn’t based on some “unsupported opinion,” like your hot take and recollections, but actual listing data going back nearly 20 years.
And once again, based on actual, historical data, which you don’t appear to have, there are “50 percent more single-family homes on the market [right now] than there were are the same time last year and prior to the pandemic [and] the most single-family homes on the market, for this time of the year, since 2012,” as outlined a few times above.
But you do make one solid point. It’s baloney that MLS subscribers cannot search for previously “active” listings within past timeframes, such as a given month in time from a previous year. So, sure I’m going off my own knowledge base, as I do. What I can say right now that’s unassailable and true is that as of today there are 297 SFRs for sale on the MLS in SF. That’s without parsing whether there’s tenants, or whether there’s an ADU or a granny unit or a 2nd unit and still marketed as SFR. Not parsing, the same search terms yields 150 sold for March. Therefore it’s just below 2 months absorption rate. Can you truly tell your readership that you haven’t seen 2 months of absorption exceeded in the past 11 years?
As we noted earlier this week, “months of supply,” particularly one that misaccounts for seasonality, isn’t a particularly good metric, unlike inventory levels (see above), which take into account both supply and demand and tracks net absorption, which is what counts.