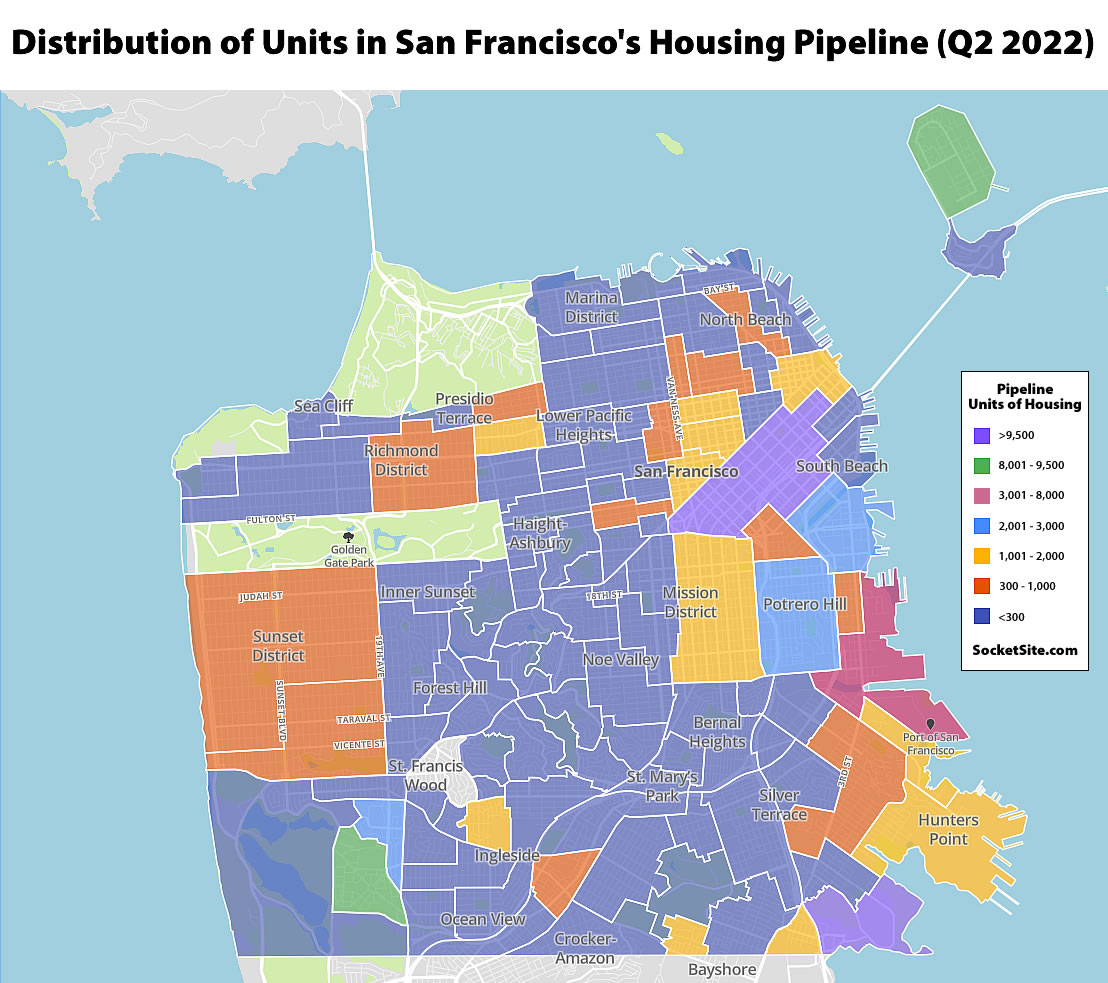
Having hit a record high in the first quarter of this year, the total number of units in San Francisco’s housing pipeline, including affordable units that are slated to be rebuilt, slipped back under 80,000 in the second quarter of 2022, driven by a 22 percent drop in the number of units that were newly proposed, according to our queries of Planning’s databases as mapped and distributed above.
In fact, the number of units that were newly proposed to be built in San Francisco dropped from over 10,000 in the first quarter of 2022 to roughly 8,000 in the second quarter, representing the fewest newly proposed units in a single quarter since the first quarter of 2014 and versus nearly 18,000 newly proposed units in the fourth quarter of 2015, with a current cycle low of 6,200 units proposed in the first quarter of 2012.
That being said, there were still over 8,000 units under construction across the city at the end of the second quarter, units which should be ready for occupancy within the next year or two, with another 9,300 units which have been fully approved, including building permits, but which have yet to break ground and nearly 13,000 units which have been fully approved by Planning and for which building permits have been requested (which is up from 9,100 at the same time last year), with over 41,000 units that have been entitled by Planning but permits for which have yet to be requested.
For context, an average of 2,600 units per year were constructed in San Francisco from 2000 through 2021, with an average of closer to 2,100 units built per year since 1991.
We’ll keep you posted and plugged-in.
This map would be easier to read if the ranges were chromatically adjacent, i.e. a rainbow sequence.
What does the periwinkle color mean? “Less than 300” probably but the color on the legend for that lowest range looks more like a dark blue.
Agreed.
The entire thing is an abomination of an attempt at data visualization.
I for one appreciate the ed.’s efforts, but yes I was contemplating cross-posting it to r/cartography…
I just came to the comments after having exactly the same frustration with the visualization. Well-intended and I do appreciate the post, but the coloring makes interpretation a challenge. One blue color means “lots in the pipeline” while the adjacent and similar color means “nothing in the pipeline.” It’s a missed opportunity for clarity.
I came to the comment for the same reaso.
What are the divisions? Perhaps our gracious editor would be kind enough to provide the underlying data, as a GeoJSON file.
This looks like the SF Association of Realtors’ neighborhood map.
Significant are the 9300 units approved and permitted but yet to break ground. In today’s environment with rising interest rates, the move to remote work and broad tech job cuts in the Bay Area (Twitter is axing 800 SF jobs) many of those units are in projects that will be indefinitely delayed if not outright abandoned.
Case in point is Brookfield’s Pier 70. Planned to have over 2000 units of housing, the doubtful viability of vertical construction caused Brookfield to not move forward with one of the project’s residential parcels earlier this year. Now, in order to try to make the stalled project more viable, Brookfield is working with the Port Authority to find ways to move forward with Phase 1 of the project, Basically Brookfield will be exempted from penalties for not starting construction for an additional 5 years. The project will thus, at the least, be delayed 6 years before breaking ground. That scenario will be replicated across many of the projects approved and permitted but which have yet to break ground.
Yep rising interest rates are causing developers to “reevaluate” their projects and some are stalling out. Its broad trend, not only SF. Developers are often juggling multiple balls in the air at the same time, and they‘re prepared to drop one if the numbers aren’t right.
Many people comment that it’s “impossible to build in SF” without any historical context as to how much progress has been made in the last 5-10 years and the momentum we have.
From around the early 70’s, when Californians first embraced environmentalism (and anti-growth), all the way until around 2012, when the second tech boom took off, SF’s units built per year was truly awful. The concept of NIMBYism didn’t even exist – that was just standard. There were no citizen activists and housing was not an issue Sacramento cared about.
Fast forward to now, and we’re averaging around 4,000 units per year in SF. There are huge numbers of citizen activists, non-profits suing cities out of compliance, and tons of data and awareness of the issue. Dozens of housing laws have been passed. It’s truly incredible how much progress has been made in the last 7-10 years. Social media/the internet/sites like SocketSite deserve a lot of credit for this shift.
It would be nice if this had a value lower than 300 as well. There seem to be about 80 neighborhoods that have between 0-300 units coming. That is a big swing, and with the new 4-plex law the next chart would show where those are getting built. But it probably won’t in this range.
Where in the Inner Richmond (orange) are they planning to build the (300-1000) units? Is that 301 or 999 units? In either case, its packed with single family homes and not any lots that I am familiar with. Something along Geary from 16th to Arguello? If they built a 4-5 story building, with 30 units, that would be 10 such new buildings at the minimum? I just don’t see this.
Perhaps 2700 California (the CPMC project) is being counted in that number? It’s on the border of the Inner Richmond and was planned to have 273 units of housing. That said, the developer has chosen not to go forward with the project and the entitlement is up for sale.
In addition to 98 approved and (nearly) permitted units to rise on the mortuary site at 4200 Geary Boulevard, there are 30 proposed units to rise at 310 6th Avenue and a whole host of smaller projects, together which total around 300 units (not including the 273 units approved to rise across the CPMC campus in the cater-corner Presidio Heights block at 3700 California).
When is the area around Glen Park BART and Castro getting upzoned?
Market St. in upper Market got upzoned more than a decade ago by the Market-Octavia Plan and some subsequent legislation. And zoning has been largely rendered moot by the state density bonus laws, so I’m not sure it matters.