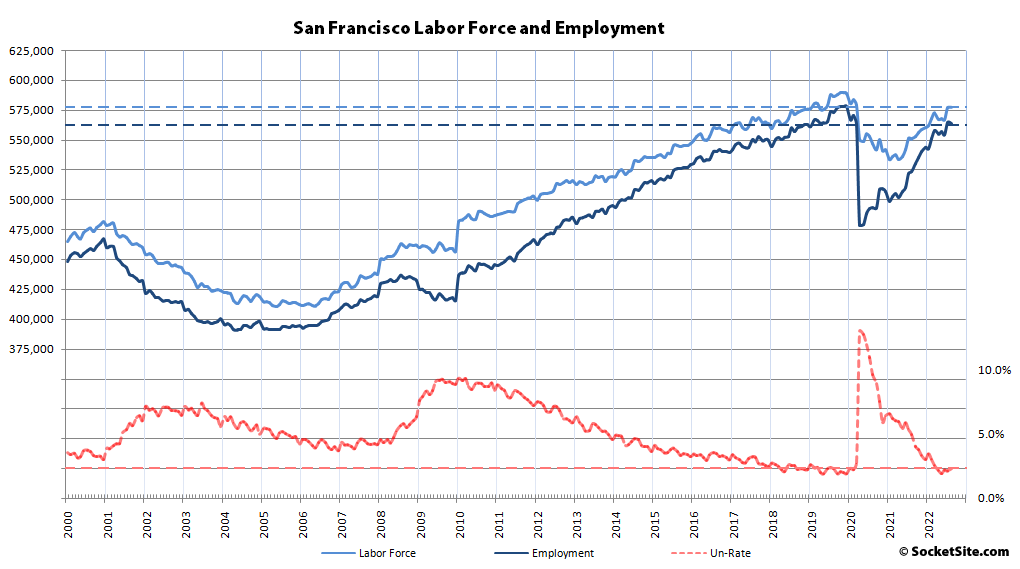
Having jumped in July, the net number of people living in San Francisco with a paycheck increased slipped by 800 in August to 563,900. As such, while there are now 40,500 more employed residents in the city than there were at the same time last year and 85,200 more employed residents than there were in April of 2020, when the pandemic-driven unemployment rate peaked at 13.0 percent versus 2.3 percent today, there are still 6,900 fewer employed residents in San Francisco than there were prior to the pandemic and 6,500 fewer people in the labor force (577,400).
The number of East Bay residents with a paycheck inched up by 1,700 in August to 1,535,600, representing 79,200 more employed residents than at the same time last year and 231,900 more employed than in April of 2020, but still 23,900 fewer than prior to the pandemic with 25,700 fewer people in the labor force.
Employment in San Mateo County slipped by 600 in July but increased by 4,300 in Santa Clara. And as such, there are now 94,300 more employed people in the Valley (1,482,000) than there were at the same time last year, over 220,000 more employed than in April of 2020, and 3,900 more employed residents in the Valley than there were prior to the pandemic with 1,800 more people in the labor force.
Employment across Marin, Napa and Sonoma counties inched up by 500 in August to 439,800, representing 18,800 more employed residents spread across the northern counties than there were at the same time last year, and 72,800 more employed residents than in April of 2020, but there are still 13,900 fewer employed residents than there were prior to the pandemic with 14,500 fewer people in the combined labor force (451,900).
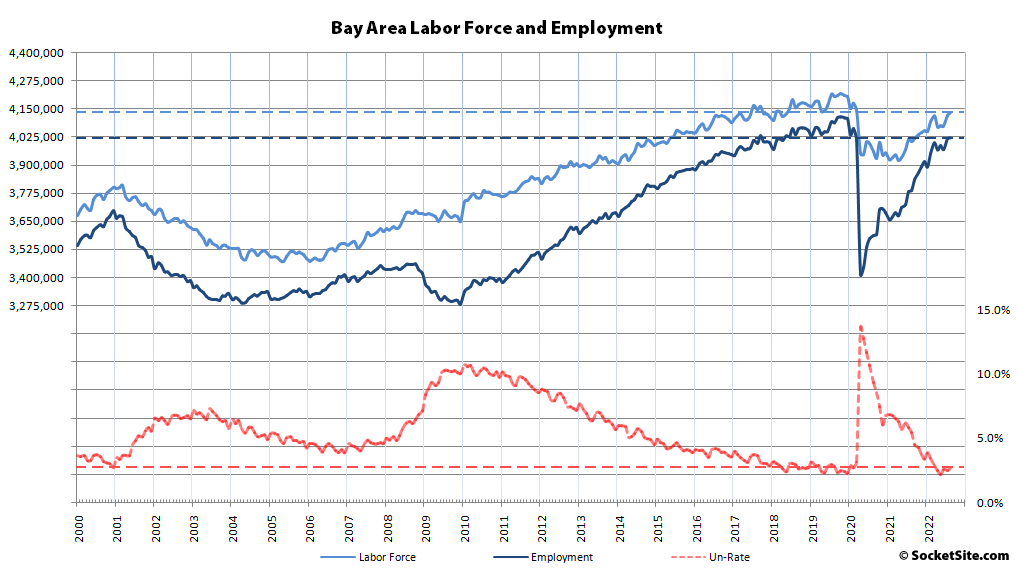
And having inched up by a net 5,100 in July, the total number of Bay Area residents with a job now totals 4,021,300, representing 232,800 more employed Bay Area residents than there were at the same time last year, over 610,000 more employed since the second quarter of 2020, and only 40,800 fewer employed Bay Area residents than there were prior to the pandemic having hit (4,062,100), with an unemployment rate of 2.7 percent.
At the same time, there are still 40,200 fewer people in the Bay Area labor force than there were prior to the pandemic having hit and over 94,000 fewer than in October of 2019, when the local labor force peaked. We’ll keep you posted and plugged-in.


Why doesn’t the East Bay, a region that includes the City of Oakland – or used to, anyway (and presumably still does) – get its own graph?
It simply wasn’t dissimilar enough from the Bay Area graph/trend to warrant one.
So noted.
Thanx