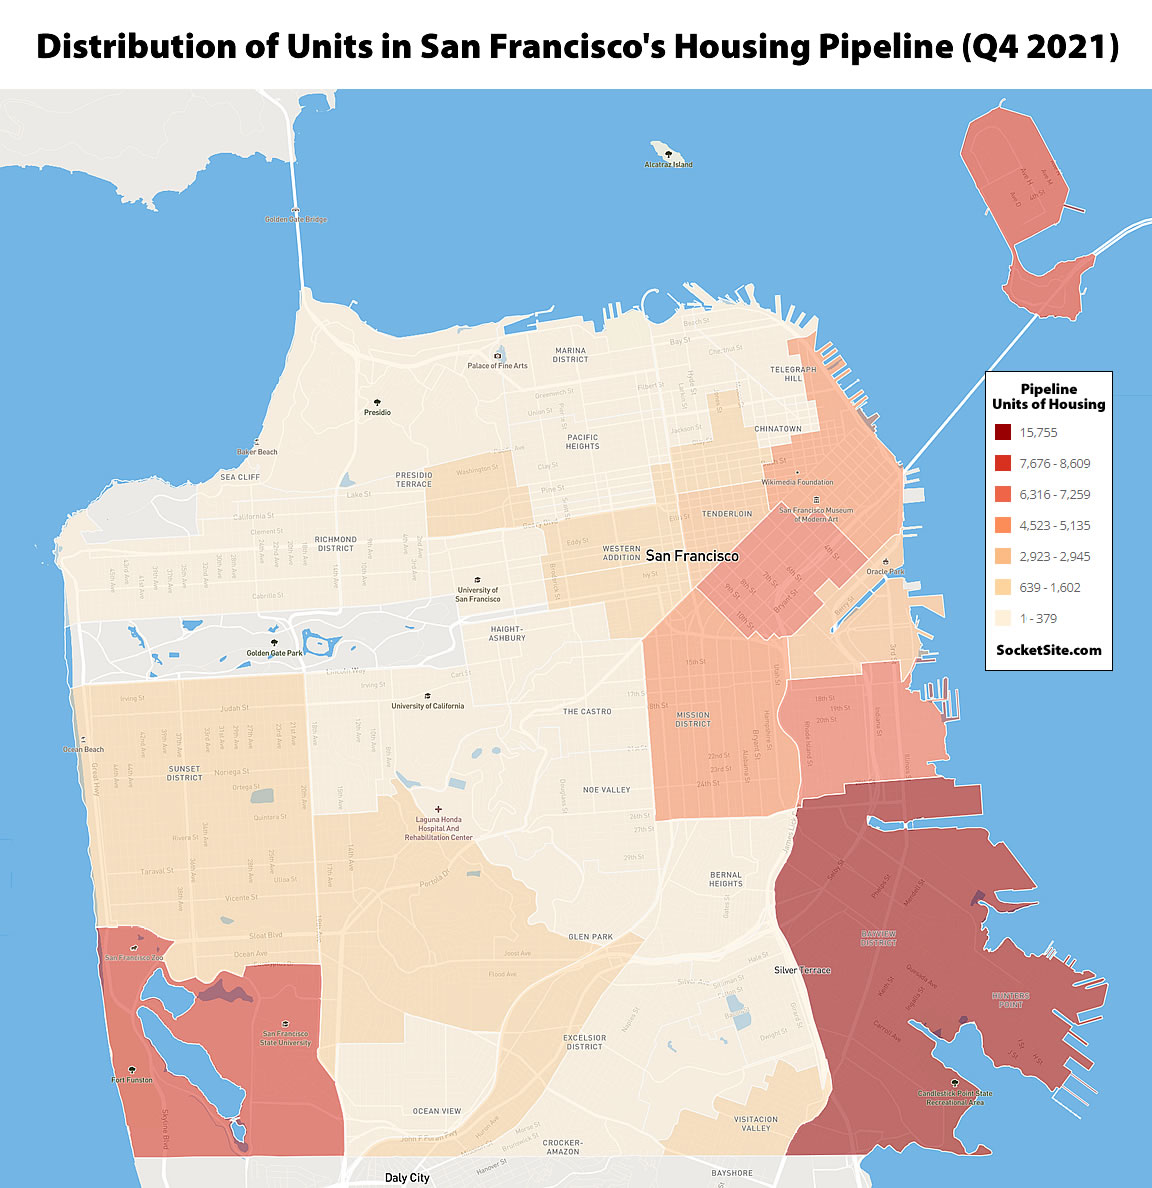
The number of units in San Francisco’s housing pipeline increased by nearly 3,000 in the fourth quarter of 2021 to 72,500, which effectively equals the pipeline count in the fourth quarter of 2020 and is within 1,300 units of the record 73,800 units which were in the works in the fourth quarter of 2019, according to our queries of Planning’s databases as mapped and distributed above.
That being said, the increase in San Francisco’s housing pipeline at the end of last year was driven by new proposals for an additional 4,300 units of housing to be built, for a total of over 13,000 units in the pipeline which have been proposed but have yet to be approved, permitted, financed or broken ground.
At the same time, the number of units under construction across the city, units which should be ready for occupancy within the next year or two, actually dropped by 1,300 to 7,800 at the end of last year, representing 9 percent fewer units under construction than there were at the end of 2020 but 10 percent more than average over the past decade with another 9,000 units that have been approved and permitted and another 9,000 entitled units for which building permits have been requested.
We’ll keep you posted and plugged-in.
Also, as the map shows, this pipeline is heavily skewed towards the southeastern neighborhoods and Parkmerced, meaning that housing in most of the city’s neighborhoods remains extremely scarce.
For all its “progressivism” the city continues to have one of the most conservative housing policies in the country.
That’s a reflection of opportunity and ROI for developers.
Large, mostly industrial lots of the southeastern neighborhoods give developers much greater economies of scale and thus more profit. In the “nicer” parts of SF, those lots are rare to non-existent. Building housing in places like the Marina, NOPA, or Inner Richmond is going to mean demolishing small, single story commercial buildings and making them 6-10 stories. That’s a real grind to do over and over again for a relatively small return.
I think it’s a safe bet that if a high-rise condominium tower was built on a place like the 2900 block of Broadway, or along one of the many blocks of Chestnut Street that are currently occupied by a bunch of low slung single story commercial buildings, it would stand a reasonable chance of delivering a healthy ROI. The reason why all of the neighborhoods shaded in red happen to be in the most marginalized parts of San Francisco has more to do with politics than it does with site constraints and economics.
Disagree on your second point. The southeastern portion of the city is industrial (noisy, polluted etc) and thus undesirable, therefor cheaper. Marginalized communities live there because they can afford it. There are more large warehouses which can be demolished for a large 300 unit building. Those are tough to come by anywhere else. 400 Divisadero is one juicy lot which is being developed. They do exist, but with each boom cycle they get snapped up (yay!). That means there will be diminishing returns in subsequent decades, as it gets harder to squeeze juice out of the fruit.
There is nothing progressive about San Francisco. It is an establishment NIMBY stronghold that caters to the wealthy land owners, period. You guys keep electing Pelosi year after year after year…
ikr, if it weren’t for Pelosi, San Francisco housing policies would be completely different!
Society sells the “American Dream” as homeownership. You cannot ask someone to park their lifesavings in an asset class, then expect them to advocate for policies that will diminish that asset’s value.
I didn’t know the definition of homeownership meant the “I got mine” entitled class constrains supply by passing laws preventing new development almost anywhere not already developed through the pejorative labeling of it as “suburban sprawl,” requiring “environmental reviews” (as if the entitled class didn’t displace any of the environment in the land they currently reside).
I thought homeownership was about having a secure home you could call your own. But my mistake, it is about pure greed.
If the tables were turned, most people in SF and California who bought when they were in their 20s, 30s, and 40s would not be able to afford that same house today.
I bought three homes in SF in my 30’s. It was really hard to accomplish. I worked my ass off. Last thing I want is for the city to reduce the value of my homes!
indeed, San Francisco’s housing policy is set by one member of the U.S. House of Representatives.
When was that ever implied? My point clearly was that she is indicative of the conservative establishment corporate Democratic do-nothings that permeate San Francisco (the voting base which DOES set SF housing policy). All of the progressive, young, counter culture, artists, creatives, etc. have moved on loooong ago.
you do realize that its the far left progressives like Peskin and Preston and Ronen and Campos that have stopped new housing at every step of the way. they are the conservative NIMBYS
Peskin is a geriatric faux progressive wealthy well connected land owner “I gots mine now screw you” just like Pelosi. He does everything for himself and his own interests and his wealthy corrupt friends. Labels mean nothing. Show me the meat and potatoes.
I moved away from SF many years ago so I don’t know much about Ronen or Campos. But I believe that Campos is a representative from the Mission district? Which, because of SF’s quirky district elections to BoS, is just a small representative of the whole of SF. Which is quite establishment and conservative (but happens to be also pro-gay and BLM [even though the city is incredibly segregated], which I guess some equate to as meaning “progressive”). But what little I do know of Campos, he seems completely bought and paid for, along with his pie-eating grin.
My mistake… I mistook Campos for John Avalos. The grin that stole Christmas
Pelosi has nothing to do with SF housing policy.
Peskin has a lot to do with SF housing policy.
It wasn’t implied at all – because it was direct statement by you. In a discussion about city housing policy, your response was “You guys keep electing Pelosi year after year after year…” Ergo you directly evidenced a belief that Nancy Pelosi sets city housing policy. You can Biden it all you want now, but it’s exactly what you said and the context in which you said it.
I have hopes that HCD is going to put a permanent end to the city taking about its “pipeline”. The pipeline is fantasy and it doesn’t result in units.
Actually, the fantastical pipeline has delivered over 25,000 units of housing in San Francisco over the past decade and nearly 50,000 units over the past two, which is up significantly from under 9,000 units in the 90s. The import is understanding how the pipeline is broken down and how each bucket is changing (see above and as we highlight each quarter).
Granted, but the fantastical pipeline contained 35000 approved or permitted units in 2014, so its probability of promptly delivering an actual box someone can occupy is less than 100%.
Once again, “the import is understanding how the pipeline is broken down and how each bucket is changing.”
Regardless, the vast majority of the 25,000 units that have been delivered over the past decade were delivered since 2014, or over 70 percent of the “approved or permitted” units at the time, which is rather far cry from a “fantasy [that] doesn’t result in units.”
I think JWB’s gist is that the “bucket is changing” downward — and in the absence of correlative data as to why / how, saying at any one time that “xx,xxx units are in the pipeline” approaches meaninglessness. To be clear, yes tens of thousands of units have been built, but does the curve of their delivery bear any strong relationship to where the pipeline stood 18 or 24 months earlier?
According to this analysis released today by UC Berkeley poli. sci. prof. Broockman, only 6372 units were delivered from “the pipeline” since 2013, using the loosest, most-inclusive definition of the pipeline.
We haven’t had a chance to review Broockman’s analysis, but considering over 25,000 units have been delivered since 2013, every single unit of which has moved through the pipeline (from proposed, to entitled, to permitted, to having broken ground), there’s a rather significant disconnect, either in Broockman’s framework, analysis or the presentation of his findings.
Having looked at it, if I may venture a WAG as to the problem: he, who is an actually an Associate Prof – not that there is anything wrong with that – (merely) looked at the disposition – within 8 years – of what was in the pipeline in 2013, but I don’t think he makes any accounting for the projects that have entered, moved thru, and been completed after that date.
Which is to say the pipeline is really a big clog of semi-imaginary projects that are always there, and many items which come and go…i.e. actually get done. Kinda’ like having a “bucket list” and a (daily) to do list, each with, say, 8 items: the former are always there, but hundred of things actually get done over time…it’s not really 50%.
I believe his argument (also mine) is that the imaginary pipeline as it stands is not as relevant for future production as generally setting the conditions that encourage building. The argument rests on two complementary facts:
1) Most of the stuff that got built in the last cycle was not in the pipeline at the beginning if it; and
2) Most of the stuff that was in the pipeline at the beginning was not built
Yes, the additional units are likely units that were not in the pipeline as of 2013 but got built in the 2013-2021 timeframe. These would be units the City put in a different category in its report, “Underutilized and Vacant Sites”.
P.S. One other difference — the Planning Department report that is in the context of is only about projects that don’t have building permits yet. So those are not included in my analysis since they’re not relevant to the particular context (how many units without building permits will get them).
It is fascinating that the City has built 50,000 new units over the past 20 years given that it’s housing policy is “dominated by NIMBYs.”
How is that fascinating? We are a half century into the housing crisis and 50k units in an unprecedented boom is paltry compared to demand and need. That number might house half the regions super commuters and not even cover births and migrants.
I have made this point here before, but you can’t just will housing into existence. Available construction materials and labor constrain the ability to build. When office building construction was more active in the City (and the Transit Center was being built), construction workers had to commute from the Fresno area to meet the need. Early in the pandemic, developers were reporting high prices for steel and concrete due to shortages/supply chain issues. Office building owners were also reporting that it was difficult to get sheetrock and other materials to do TI work.
Additionally, new housing development depends on the availability of scarce debt and equity capital. Another 5,000 units at a cost of $600K each requires $3 billion. Given all the concern in this comments section and elsewhere about quality of life in San Francisco and some outmigration to other metros, some of the investment capital that might go to San Francisco is being deployed to places like Miami, Austin, and Phoenix.
According to the City’s Pipeline Dashboard, 48,924 units have been *entitled* and 4,545 units are *under construction*. At this point, it is up to the developers to move forward with the other 44,379 units. If they don’t get built on your timetable, you can’t blame that on “NIMBYs”.
FYI – it would appear as though the City’s Current Dashboard tallies, and any dashboard-based reports, are incorrect (versus our queries of the underlying database and totals above).
only 9400 units are permitted. The whole “entitled” thing is a ruse. You can’t build until everyone approves. There are over 20,000 applications turned into planning. But there are many many very slow steps even after planning approves before you can build.
Re: “unprecedented boom”, that 20-year pace is lower than most other such periods of city history, including 1940-60, 1950-70, 1960-80, and 1970-90. The last 20 years only looks boom-like compared to the prior 20 years, which were the all-time lowest decades for housing production in SF.
seattle built that many units in 10 years
In some ways the pipeline is a pipedream. Just saying.
I assume that Planning is timely in removing projects from the pipeline that are abandoned. The Renzo tower, the Oceanwide condominium tower, the massive Kirkham Street project in the Inner Sunset and the tower on Mission near 10th (IIRC). About 800 units that won’t come to fruition.
Are numbers tracked for entitled projects put up for sale (rather than built)? Or entitlements that have been extended for years – the skinny Howard Street tower? Those numbers would be revealing and add a better, more nuanced view of the pipeline.
And once again, the “pipedream” has delivered over 25,000 units of housing in San Francisco over the past decade and nearly 50,000 units over the past two, which is up significantly from under 9,000 units in the 90s and the import is understanding how the pipeline is broken down and how each bucket is changing (see above and as we highlight each quarter).
There’s no difference between a project that has been entitled and banked or put up for sale, either practically or in the reporting. It’s the permitting of a project that really matters, second to breaking ground.
I believe you mean 5000 units over the past two years.
Still and all, permitting matters but is no guarantee, HP/CP is projecting 10K units but has run into trouble with contamination and lawsuit from some of the already built units. Will all that land be available for development given the contamination. Then there is TI – climate change notwithstanding. A politically connected company is involved and that to get the taxpayer to pay for the huge remediation effort needed. I doubt those towers see the light of day.
Add to the mix mixed used developments like the Tennis Court project. 118 units of on-site BMR housing was to be included. The project has been abandoned as an office development and the shift to lab space entails removing the underground tennis courts. City is saying no. Project will likely not be built including 118 units of housing.
Permitting is just the start and by no means a guarantee.
50,000 in the last two decades.
Thank you. Mea culpa.
50,000 units over the past two decades. Permitting is not “just the start” and thank you for making our point about the import of understanding how the pipeline is actually broken down as you just listed a bunch of units that have yet to be permitted.
Renzo wasn’t permitted. The Kirkham project wasn’t permitted? The Howard Street tower was not permitted – yet it’s on its 3rd permit extension (or so).
When people throw around numbers and seem to imply they make a point, I would appreciate the context to make sense of them so I can evaluate that point. 50,000 units .. sure, it sounds like a lot? But also, what % growth of that is over time? How does that compare to our peer cities? And how about our population growth in that time?
wikipedia says SF city population grew by 97,000 people during that time. I don’t know what the “average occupancy” of a housing unit is. If it’s “2” then it looks like we basically “kept pace” with population growth over these two decades. That might actually be an impressive feat. Or, given the housing shortage, maybe it wasn’t nearly enough.
I think the point is made that “we’re definitely not doing nothing”, but I think it’s much harder to say “we’re doing enough”.
Exactly. 50,000 units over 20 years sounds good until one compares it to other cities. Seattle (about the same size as SF – 787K/815K populations) has produced over 100K units of new housing in the past two decades. It’s been producing 10K plus units/year in recent years.
This from a 2017 SFBT article in part titled A Tale of Two Cities – Seattle builds, San Francisco lags:
“From 2010 to 2016, the City by the Bay added a paltry 15,730 units. Its northern neighbor added 32,000. Since 2000, Seattle has seen 70,000 new homes completed while San Francisco saw just over 38,000”.
Simple solution buy back parkmerced and stonestown apartments and keep it under the SFCLT and/or public housing co-op with infill alternatives vs demolition. Than do the replacement of the 11 non-retrofitted towers with taller new modern towers. You can infill Parkmerced’s garages with new townhomes and town houses while retaining and rehab of existing 2-story units. 10 years and no ground broken shows they want to flip and do a quick gain vs the long run of construction…
I’d be curious to know what the experts at Socketsite think of the city’s projection that the *current* pipeline will yield 46,000 new units from 2023-2030. See table on p. 8 of the draft housing element sites analysis.
I think they should call it the Housing Pipedream
Jamming the 50K new units into a small, crowded city was already a feat. How are we going to fit all of the new traffic, pollution, etc. From all of these proposed new units? Will we finally get BART to other parts of the city? Also I would be curious to know how SF performs in building against other parts of the Bay Area. Feels like it is all SF and Oakland. Where are Sunnyvale’s new residential towers for all of the office buildings they are building, or do SF taxpayers get to continue underwriting their costs of development?