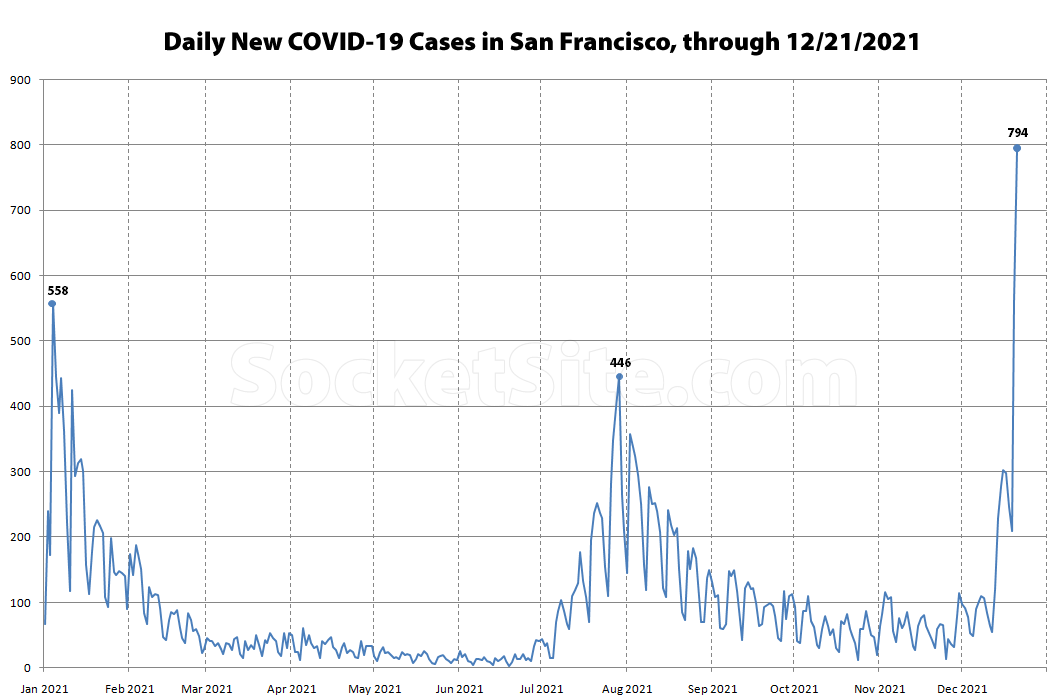
Compounded by an increase in the detection of asymptomatic cases that might have previously gone undetected, with proactive testing for holiday travel, parties and other get-togethers having jumped, the number of new Covid-19 cases in San Francisco hit a record daily high of 794 on December 21, which equates to an all-time high case rate of 91 new cases per 10,000 residents, a number that’s likely to be upwardly adjusted over the next week.
The previous daily high for new cases, save for 562 new cases flagged on December 20, was 558 cases or roughly 64 cases per 10,000 residents on January 4 of this year (followed by a Delta-driven spike of 446 cases, or 51 cases per 10,000 residents, on July 29).
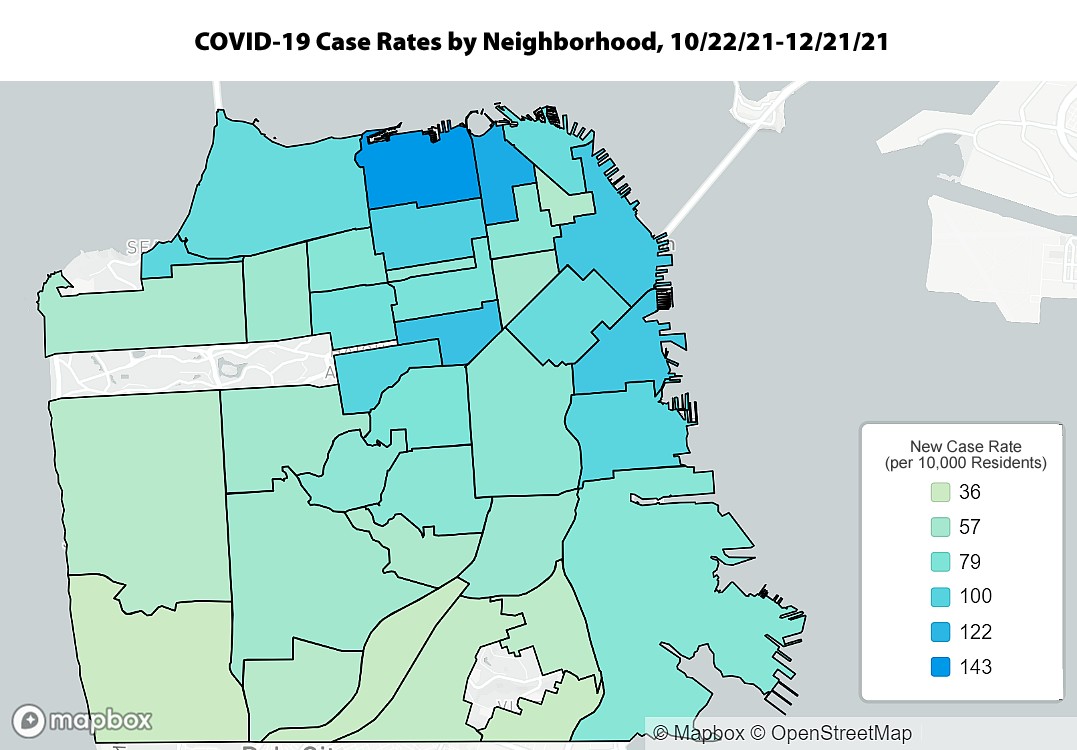
And the six neighborhoods with the highest cumulative case rates over the past two months were the Marina (362 new cases/143 new cases per 10,000 residents); Russian Hill (234/129); Hayes Valley (224/114); South Beach/Financial District (234/109); Mission Bay (144/109) and Pacific Heights (251 new cases/103 new cases per 10,000 residents), representing a dramatic shift from earlier in the pandemic when Bayview Hunters Point, the Tenderloin, Visitacion Valley and the Mission had the highest concentration of cases.
UPDATE (12/28): Having been upwardly adjusted, the number of new Covid-19 cases in San Francisco actually hit a record daily high of 860 on December 21, which was surpassed by a new all-time high of 894 cases on 12/22 and then 964 new cases, and counting, on December 23.
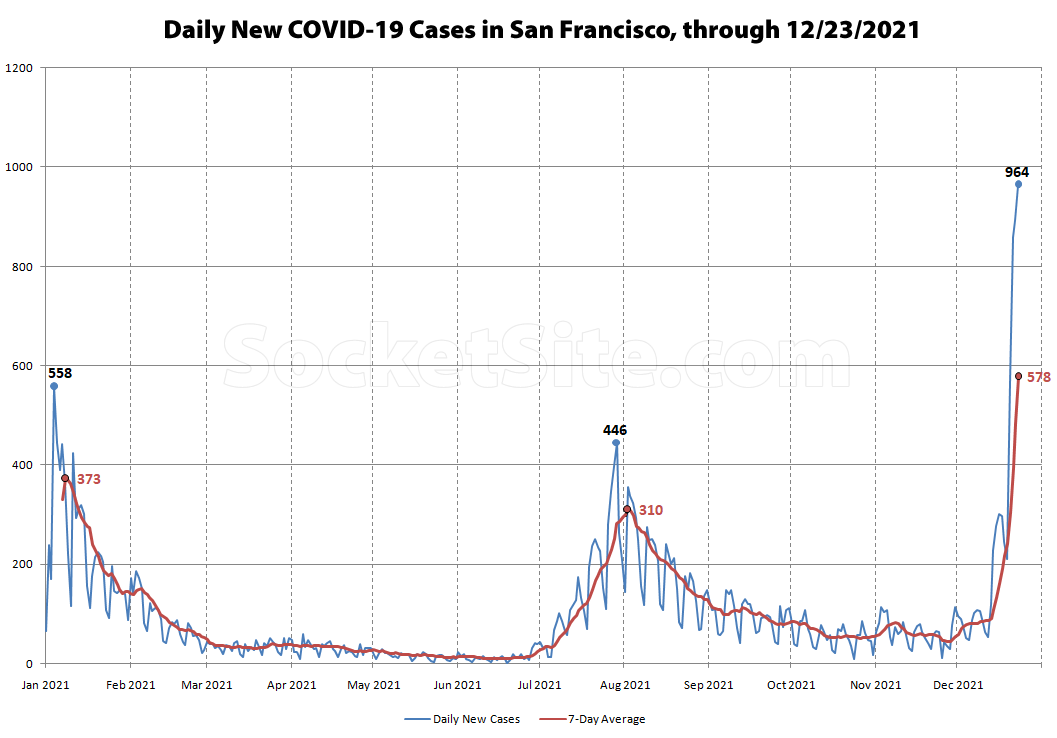
At the same time, the 7-day average number of new daily cases, which hit a new all-time high of 395 on 12/21, was up to nearly 600 on 12/23, having peaked at 310 for Delta and 373 in the first (Alpha) wave.
UPDATE (12/29): Having been upwardly adjusted, the number of new Covid-19 cases in San Francisco actually hit a record daily high of 1,054, and still counting, on December 23 and the 7-day average ticked over 600 on December 24.
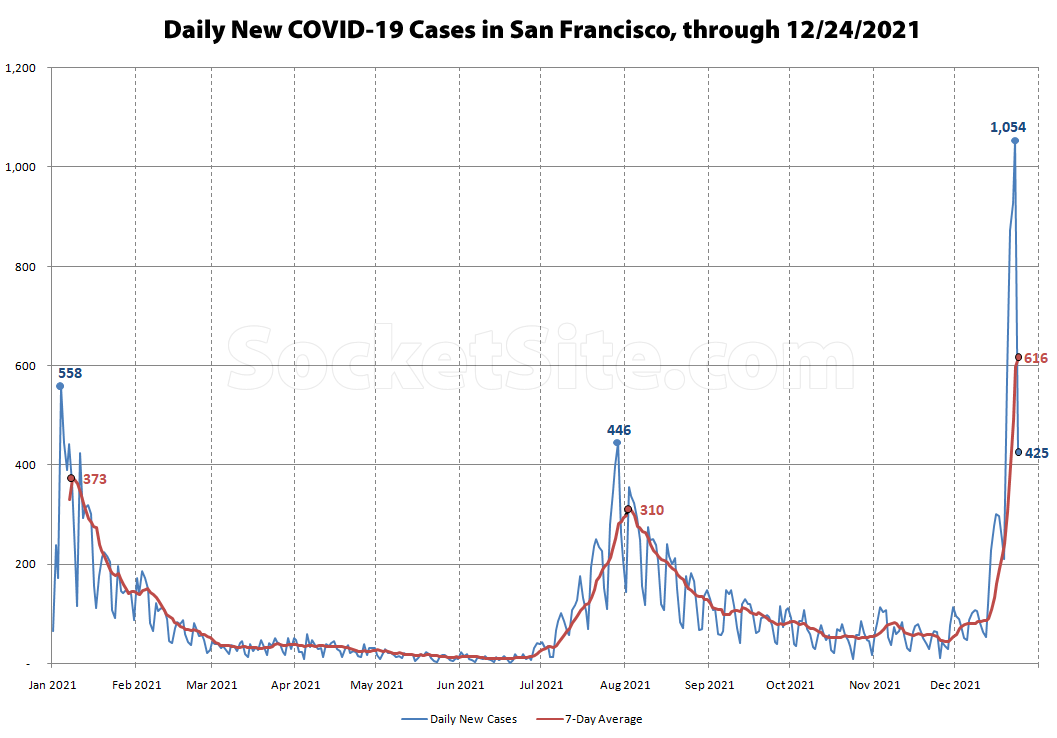
On a positive note, while the precipitous drop in the number of new cases identified on December 24 was primarily a factor of a drop in the number of tests administered on Christmas Eve, the preliminary test positivity rate was down to 7.1 percent, versus 11.6 percent on December 23. But hospitalizations have started ticking up as well.
UPDATE (12/30): The record number of new Covid-19 cases detected in San Francisco on December 23 has ticked up to 1,075 for a 7-day average of 603 cases per day. The 7-day average through 12/24 has ticked up to 629. And unfortunately, the test positivity rate on December 23 has been upwardly adjusted to 11.8 percent with a 12.5 percent positivity rate on December 24.
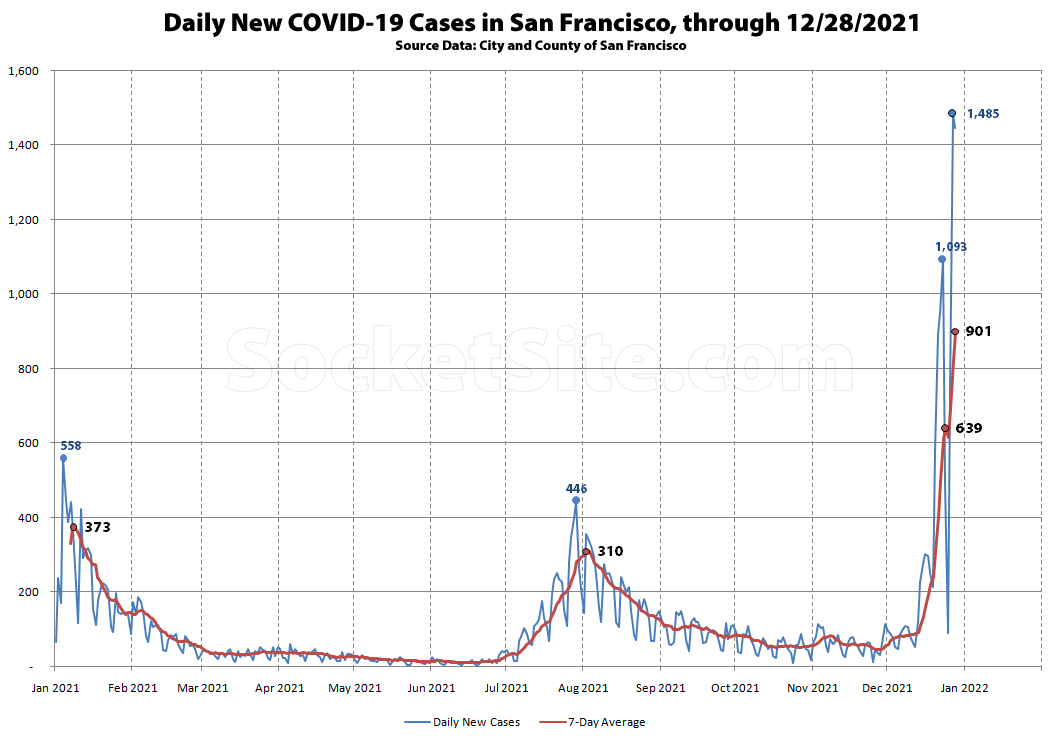
UPDATE (01/03/22): Having hit a record-high of 1,093 on December 23, the number of new Covid-19 cases detected in San Francisco hit a new all-time high of 1,485 (and still counting) on December 27. And despite a drop in testing on Christmas, Christmas Eve and the day after Christmas as well, the 7-day average number of daily new cases detected in San Francisco ticked over 900 on December 28 with a test positivity rate of 18.3 percent on December 27.
UPDATE (01/04): S.F. Will Soon Average Over 1,500 New COVID Cases Per Day
This makes sense. Anecdotally, hearing from many cautious sensible vaccinated friends in SF that they have been exposed or tested positive. Same trends in NY as if the virus has some how breached the NPR class of people at last.
My supposition is that we will trend higher for a month and there will be a bit more freaking out.
Also woooo! Santa Con! Who wants to go frat bar it up in the Marina!?!!!!!!
The preachy white-liberals are now getting hit. They are all either asymptomatic or have a cold that will last 2 days. Let’s shut everything down again for this.
While the severity of the latest surge appears to be lower, particularly for those who have been vaccinated, keep in mind that hospitalizations typically lag case rates by around 3 weeks. And in terms of shutting things down, the surge is already doing that on its own, particularly with respect to hospitality, travel and events.
Also the word “again” is wrong. We did not “shut everything down” before, so we cannot do it again.
Missed it by that much: Stay-at-Home Order for Bay Area Counties (March 2020)
That is not “shutting everything down.”
Many of the people I know have come down with this mild flu in the last few weeks. I believe there have been zero deaths nationwide. CNN reported the death of an unvaccinated conservative in Texas, but later his doctors denied that Covid was the cause of death.
You believe wrong.
800,000 dead Americans and some people are still calling it the flu.
Yah. The preachy white liberals. Those creeps who have wanted to keep the vulnerable out of hospitals and from dying. The virus has mutated to survive, and appears to be weaker for it. This is from our efforts in vaccinations and building immunity. You’re welcome, Pean.
Will you also take accountability for the highest unemployment rates in the nation vs states that didn’t enact strict Covid response measures? Will you take responsibility for the full-on mental health crisis among children in this country? The record high suicide rates among young girls and minorities? Will you take responsibility for the fact that school children are scoring record lows on basic reading and math?
The policies and hysteria you want me to thank you for put a generation of our students behind. Sure, we saved a marginally higher number of lives (compared to states that moved on from this a year ago), but the long-term impact of these decisions will be felt for a decades. CA and SF are noticeably falling apart. Go to our downtown in the middle of week, it’s a level of sadness I cannot explain.
Not to mention the loss of meaning of the word “marginally”…
It was the first link on Google I found, if it’s not accurate, @admin/ @SocketSite please delete the post. Don’t want to spread misinformation.
Done. A key piece of missing context from the report you quoted and we removed: “over the last seven days.” The relative outcomes between California and Florida, over the course of the pandemic, are the opposite of what you showed.
Pean, do you have the statistics to back up your claims?
The death rate from COVID in SF has been 1/3 the national average over the course of the pandemic. That is a success. The data on suicide has been mixed. We could have had three times as many families grieving the deaths of loved ones.
Exactly.
SF’s per capita death rate (Johns Hopkins tracker) is about .08%, and US wide it is about 0.25%.
And to turn the analysis the other way… If the entire country had been as successful as SF, over 550 thousand people would not have died from covid in the US.
But of course this is wrong. If you clamp down an exponential growth rate, you get an exponential savings, not a linear. Eg. People in SF caught covid from outside sources as well as SF local transmission, so a nationwide improvement would have driven the feedback rate even lower.
Widespread or universal surveillance testing is likely to produce a result of 5/1000 or so. Which is also why surveillance testing is kinda useless at this point in time.
5/1000 just from the false positives, that is.
Having dropped under 2 percent back in September, the test positivity rate in San Francisco was 9.3 percent on 12/21 and the 7-day average rate is likely to tick over 6 percent, and hit a 20-month high, within a week.
The high prevalence is why the surveillance testing is pointless.
I’m not understanding the logic. Don’t you mean the opposite? The higher the prevalence, the less the false positive rate biases the numbers. And if the false negative rate is symmetric to the false positive, then the point estimate should be unbiased regardless. It would just be the variance that would be high and this can be improved through larger samples.
I don’t believe you’re correct: if the two rates are symmetric, then the false positives will overwhelm the false negatives, simply b/c the base that the latter operates off of (infections) is small
(say you have 5% false results and a 1% infection rate; if you test 100K people you “should” get 1000 positives, but 50 of those 1000 will show as false negatives, so you’ll have a net of 950 true positives; meanwhile, you’ll get 4950 false positives…4950 of 5900 – 84% – of the positives will be false)
Obviously it matters a lot what the false rates are, but they’ll never be symmetric…unless infection rates near 100%
I would blame Santa Con given those neighborhoods
I guess this is the begining of the “winter of death” for the unvaccinated.
Also, unfortunately, for people who may need to be hospitalized for a non-Covid related reason, but they cannot because all beds are being occupied by unvaccinated. This is an avoidable tragedy.
SocketSite’s chart makes it look as if we’re currently doing worse than in previous waves, based on a single day with tons of positives. But the seven-day average is still below the two previous peaks. That may change soon, but for now the SocketSite chart seems a little sensationalistic.
That’s incorrect. The 7-day average through 12/21 was already 384 new cases per day, which was higher than either the 7-day peak for Delta (310) or the initial 7-day peak of 373 new cases per day back in January. Or in your own words, “we’re currently doing worse than in previous waves,” at least in terms of the rate of new infections.
Hey, you deleted my link to the SF covid page showing a lower seven-day average, according to their methodology. That’s not very nice. If you want to respond to my argument itself, fine! But don’t remove a key part of it and then respond to a straw man.
Your link was flagged and removed for being a duplicate of a link we provided in the body of our post above.
The “lower seven-day average” on the SF.GOV page isn’t due to a difference in methodology, it’s due to the fact that it currently only reflects the average/data through 12/18 while we’re working with the underlying data through 12/21 (which could be adjusted upward over the next few days).
The SF.GOV average should be around 240 later today, once it reflects the average through 12/19. Tomorrow it will be around 300. And on Thursday it will hit/surpass 380, reflecting the case data through 12/21. That’s not a matter of us being sensationalistic, guessing or even projecting, it’s an understanding of the data, reports and maths.
Having skipped over the average through 12/19, the SF.GOV average has just been raised to 305, reflecting (updated) case data through 12/20. Tomorrow it will surpass 380, and possibly 400, reflecting the case data through 12/21.
Per our math and the City’s data, the 7-day average number of new cases detected in San Francisco, which had peaked at 373 in the Alpha wave, ticked over 900 on December 28.
While the official 7-day average through 12/21 has been upwardly adjusted to what was a record high of 398 new cases per day, the 7-day average through December 24 currently stands at 616 per the City’s data and our math.
Omicron spreads like wildfire, hence the high number of cases. But it is far less virulent than delta or any previous strain. And SF has very high vax rates to boot, and the vaxes are very effective against Omicron particularly against serious illness (still may test positive). Hence, SF has not seen, and will not see, hospitalization or death rates from Omicron in anything like prior waves. We can see this trend in South Africa and Denmark, where Omicron hit earlier. The unvaxxed (still around 100,000 in SF) will get hammered and we will see deaths among them. If you’re vaxxed, don’t stress (but still wear a mask indoors to protect children too young for the vax, the immunocompromised, and yes the unvaxxed idiots).
While case may increases, hospitalizations in SF are low and remain flat.
Once again, while the severity of the latest surge appears to be lower, particularly for those who have been vaccinated, keep in mind that hospitalizations typically lag case rates by around 3 weeks.
They were flat, but no longer.
Dec 22 33
Dec 23 32
Dec 24 34
Dec 25 41
Dec 26 43
Dec 27 52
Matt Allenford, care to guess what the next numbers will be in this table?
All numbers have been revised lower. Dec 27 has been revised down from 52 to 42.
Yes, Acute Care has increased. Intensive Care is FLAT.
People are going to the hospital and testing positive for covid. Now 52 (12/29) out of 883,255 people in SF. Let’s keep things in perspective.
That’s incorrect. The number of hospital beds occupied by COVID-19 patients in San Francisco, which totaled 52 on 12/27, ticked up to 63 as of 12/29, including 11 people in intensive care (which is up from a total of 17 hospitalized COVID patients on 11/20 and already half the Delta peak of 123 on 8/15).
But once again, hospitalizations typically lag case rates by around 3 weeks, intensive care counts lag acute care admissions, and there are significant negative impacts from the surge in cases beyond hospitalizations and/or deaths.
Sorry, the total hospitalization numbers are accurate. Acute care has gone up.
Intensive care remains flat and at a low. Time will tell.
Still 3 people under 30 of 883,255 have died from Covid in the last 2 years. Three! Most likely with co-morbidities.
The number of intensive care beds occupied by COVID-19 patients has actually doubled since late November. Intensive care counts lag acute care admissions, which typically lag case counts by around 3 weeks. And three weeks ago the average daily case count was less than a tenth (1/10) of what it was on December 28.
The number of people hospitalized with Covid-19 in San Francisco has ticked up to 97, as of January 2, including 19 people in Intensive Care, which is up from 5 in late November and having doubled, again, over the past week.
The number of people hospitalized with Covid-19 in San Francisco has ticked up to 112, as of January 3, including 23 people in Intensive Care and an increase in occupancy rates (versus simply an increase in the mix of patients “with” Covid).
UPDATE: Having been upwardly adjusted, the number of new Covid-19 cases in San Francisco actually hit a record daily high of 860 on December 21, which was surpassed by a new all-time high of 894 cases on 12/22 and then 964 confirmed new cases, and still counting, on December 23.
At the same time, the 7-day average number of new daily cases, which hit an all-time high of over 380 on 12/21, as we originally calculated, was nearing 600 new cases per day on 12/23, as newly added to the UPDATE(D) chart above.
Breakthrough infection = vaccine does not stop contraction.
The 7-day average case rate for unvaccinated residents (58.6/100,000) is nearly twice as high as for vaccinated residents (32.5/100,000) and the gap between the two has been widening, not narrowing, with the latest surge.
But more to the point: No COVID-19 vaccine completely prevents all COVID-19 infections and fully vaccinated cases (“breakthrough infections”) are expected. But if you are fully vaccinated and do contract the virus, your “symptoms will most likely be mild and similar to the common cold” and you’re “highly unlikely to be hospitalized due to COVID-19.”
Obviously. What’s your point?
Yes, we all knew that. Thankfully my breakthrough infection only lasted 3 days because the vaccine works.
Looking at infections to measure Covid severity is a pointless metric. We need to move to hospitalizations, that haven’t increased anywhere else with Omicron.
Beyond the most vulnerable and frontline care givers, there’s a growing list of workers, mangers and business owners that might not agree with that take, particularly those who are suddenly on an unexpected “winter break” (in PR speak) from their normal wages and revenues.
I would assume it’s because these areas are wealthy and people are traveling again for the holidays. They are vaccinated and have received their boosters. They might feel that since symptoms and hospitalization is low unless you are unvaccinated it’s worth taking the risk.
To be a broken record, COVID is *never* going away.
It will fluctuate with seasons, variants, etc. *forever*.
If you’re vaccinated, but waiting for some magical event to live your life, you’ll never stop waiting.
Any “temporary” measure you’re taking today will need to be taken permanently.
If you’re as vaccinated as possible and still afraid, that fear will never end.
This framing is incoherent. Covid fluctuates, yes! Like the weather. So if you don’t want to get covid, you adjust your behavior according to the covid “weather.”
Today it’s cold and rainy in SF. I don’t want to get cold and wet, so I’m not going out for a jog today. That’s my “temporary” measure. I’ll go jogging tomorrow when it’s sunny!
Right now omicron is raging, I’d rather not get sick, so I’m avoiding crowds temporarily. It’s not about being afraid any more than my decision not to go jogging today is about being afraid.
Interesting, calibrated fear.
So I guess you’ll be watching the “COVID weather report” and modifying your behavior *forever*.
If I may ask, what are the numbers on the forecast that cause your particular level of fear to kick in? Case counts? Positive %? Hospitalizations?
When exactly were you “jogging” this year? When did you stop?
Zeb sounds reasonable to me. When I am skiing, I calibrate my behaviour according to the difficulty of the runs. When driving, I calibrate my speed according to the road conditions and traffic at the time. You might say I slow down in pouring rain due to calibrated fear, but I would say it’s being sensible. And yes, I will be modifying my driving forever, based on weather conditions.
Also, why the quotes? Is there a reason to put “jogging” in quotes? Are you doubting that Zeb jogs?
I was more interested in what level of/which COVID numbers caused the level of fear to stay at home, avoid gatherings, etc. My original point was that the numbers will *never* be zero, so the number watchers will presumably be looking at the COVID report every day and thinking “can’t do this, can do that” for the rest of their lives.
Also, “jogging” in quotes meant “leading your life without COVID fear” tied to the graph above. Were they OK with gatherings a 50 cases a day? 100? but not 200? etc.
So why do you call it “fear”? Is that different than changing one’s driving habits in heavy rain? Is that “driving fear” or is it reasonably adjusting my actions to my surroundings?
I’m not going to get into what numbers I look at because that’s not the point. You seem to think that any consideration of the state of the pandemic amounts to living in fear. But people make assessments of environmental risks and adjust their behavior all the time. I also like to go hiking, but I’m not going to go hiking in the mountains when there’s a red flag warning. And if I’m going on a long hike I’m going to carry plenty of water. I’m not living in fear of wildfires or dehydration.
UPDATE: Having been upwardly adjusted, the number of new Covid-19 cases in San Francisco actually hit a record daily high of 1,054 (and counting) on December 23. At the same time, the 7-day average number of new daily cases, which hit a new all-time high of 395 on 12/21 and was up to nearly 600 on 12/23, was over 610 on December 24.
On a positive note, while the precipitous drop in the number of new cases identified on December 24 was primarily a factor of a drop in the number of tests administered on Christmas Eve, the preliminary test positivity rate was down to 7.1 percent, versus 11.6 percent on December 23. But hospitalizations have started ticking up as well.
UPDATE: The record number of new Covid-19 cases detected in San Francisco on December 23 has ticked up to 1,075 for a 7-day average of 603 cases per day. The 7-day average through 12/24 has ticked up to 629. And unfortunately, the test positivity rate on December 23 has been upwardly adjusted to 11.8 percent with a 12.5 percent positivity rate on December 24.
Interesting point about case counting and home covid test kits in the NY Times (12/30).
Assuming decent false positive and negative rates, the home tests may be filtering out many test cases, both positives who then don’t bother getting a confirmation test, and negatives who’s previous tests drove the positivity rate down.
If this is the new normal, unless a random population sample process emerges, the covid weather report may need to transition to sewer system testing and hospitalization records.
There has been no meaningful increase in deaths in South Africa where Omicron was discovered over 7 weeks ago (week of Nov 8th).
Let’s not forget about financial incentives of the vaccine. US taxpayers fund 100% of vaccine development and distribution, and pharma companies keep all the proceeds. That’s $36 billion in revenues for Pfizer alone in 2021. Obviously the pharma industry has a massive financial incentive to vaccinate the world and give everyone a booster shot every month until the end of time.
Thankfully that’s correct, as the financial incentive resulted in the development of multiple vaccines, in record-breaking time, blunting the impact of the pandemic. And hopefully the severity of the Omicron surge will be muted as well. But unfortunately, there are significant negative impacts from the surge of any COIVD-19 variant, beyond deaths or even hospitalizations (which are on the rise along with traffic to ERs).
You are flat out wrong about the vaccine development being funded 100% by US taxpayers. To choose among many examples, the EU is also funding Covid vaccines, as is the UK and others.
Pfizer declined development money (although guaranteed sales probably made it easier for management to dive into their piggy bank to fund the development) . That said, of course your guess about the underlying motive is on target – Big Pharma has a thing for big $$’s.
Perhaps that means they are managing the worldwide news flow to stoke fear and sell booster shots, but there needs to be some evidence to advance beyond generic conspiracy theory fodder.
In South Africa where the vast majority of folks are unvaccinated hospitalizations and deaths do not seem to match the current hysteria predicting a winter of death for the unvaccinated.
The principle concern has to do with hospital capacity and resource management and that has been the chief concern for nearly two years.
One thing with South Africa is that they’ve had multiple large waves go through a largely un-vaxinated population. So they are theorizing that many if not most people have some level of immunity through exposure/infection from at least one previous strain. Also there is some selection bias as people who are particularly at risk may have already succumbed to the virus during a previous wave.
Also, look at the scale of the current surge. The latest data on sf.gov shows ~1,400+ cases f0r 12/27 and 12/28 (And these numbers are not yet final, tend to get revised up when new cases come in). Pre-Delta in may-june, the SF 7 day average was in the 10’s. So balance around a 100x increase in cases with a possibility that omnicron could be less severe. As Zeb said above, letting your guard down when there are 14 cases a day is very different from being cavalier about 1,400 cases a day.
Also, as SFRealist pointed out, Hospitalizations are increasing in SF. Lastest 12/29 data shows 63 hospitalizations, about double the number from 12/23 just 6 days ago. Pre-delta hospitalizations were also in the 10’s. So we are already at 4-5x hospitalizations from then.
UPDATE: Having hit a record high of 1,093 on December 23, the number of new Covid-19 cases detected in San Francisco hit a new all-time high of 1,485 (and still counting) on December 27. And despite a drop in testing on Christmas, Christmas Eve and the day after Christmas as well, the 7-day average number of daily new cases detected in San Francisco ticked over 900 on December 28 with a test positivity rate of 18.3 percent on December 27.
UPDATE: S.F. Will Soon Average Over 1,500 New COVID Cases Per Day