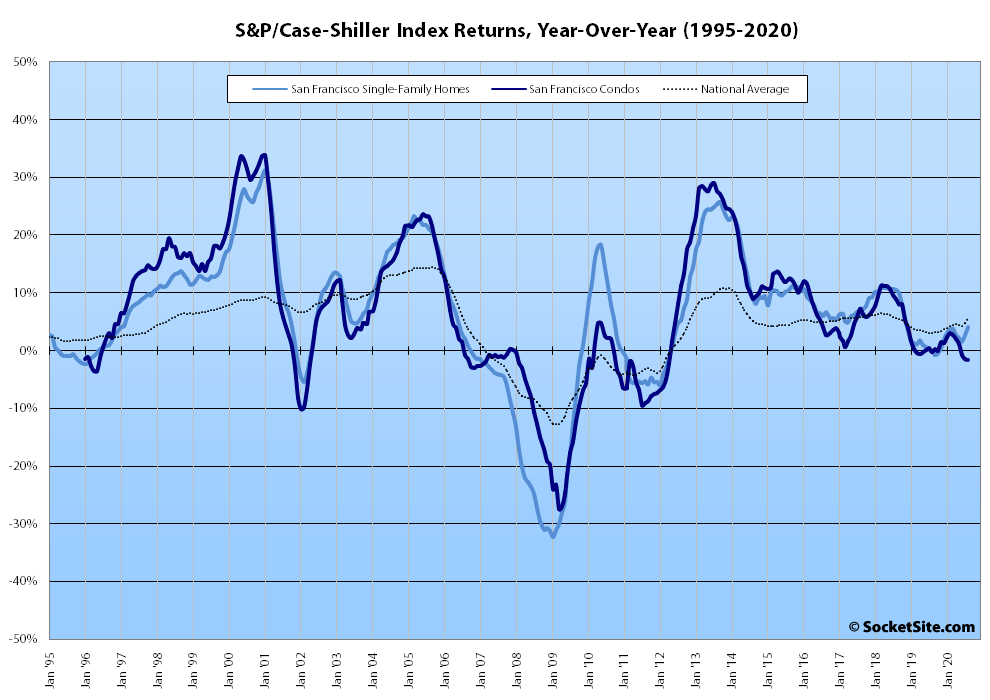
Having ticked up an upwardly revised 1.1 percent in July, the S&P CoreLogic Case-Shiller Index for single-family home values within the San Francisco Metropolitan Area – which includes the East Bay, North Bay and Peninsula – inched up 0.8 percent in August for a year-over-gain of 4.1 percent versus a 5.7 percent year-over-year gain nationwide.
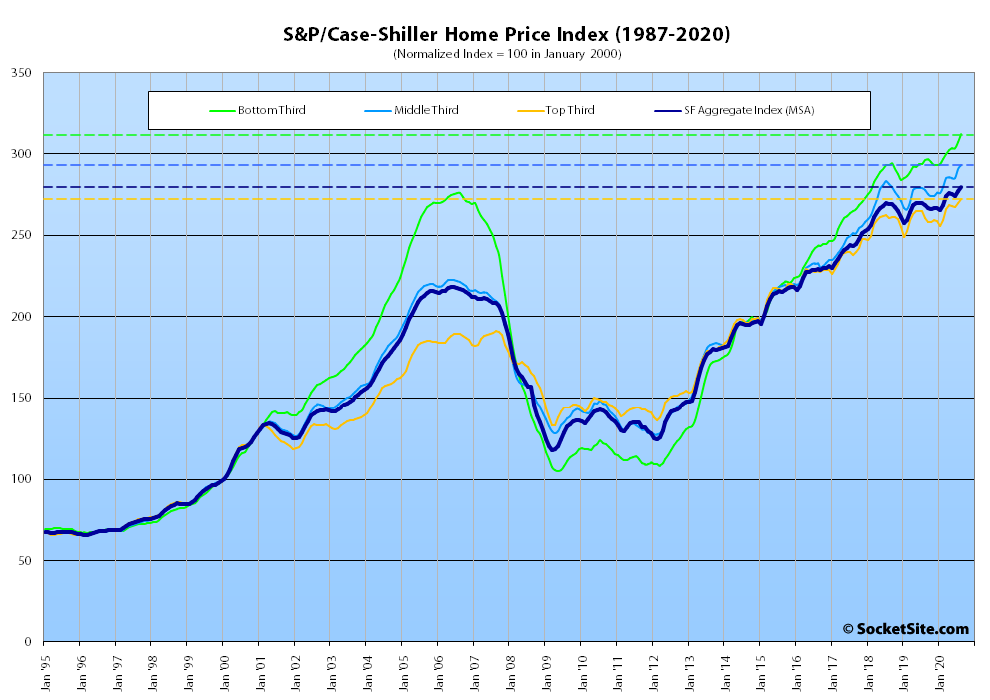
At a more granular level, the index for the least expensive third of the market ticked up 1.6 percent for a year-over-year gain of 5.4 percent; the index for the middle third of the market inched up 0.8 percent for a year-over-year gain of 5.4 percent; and the index for the top third of the market inched up 0.9 percent in August and was 4.5 percent above its mark at the same time last year.
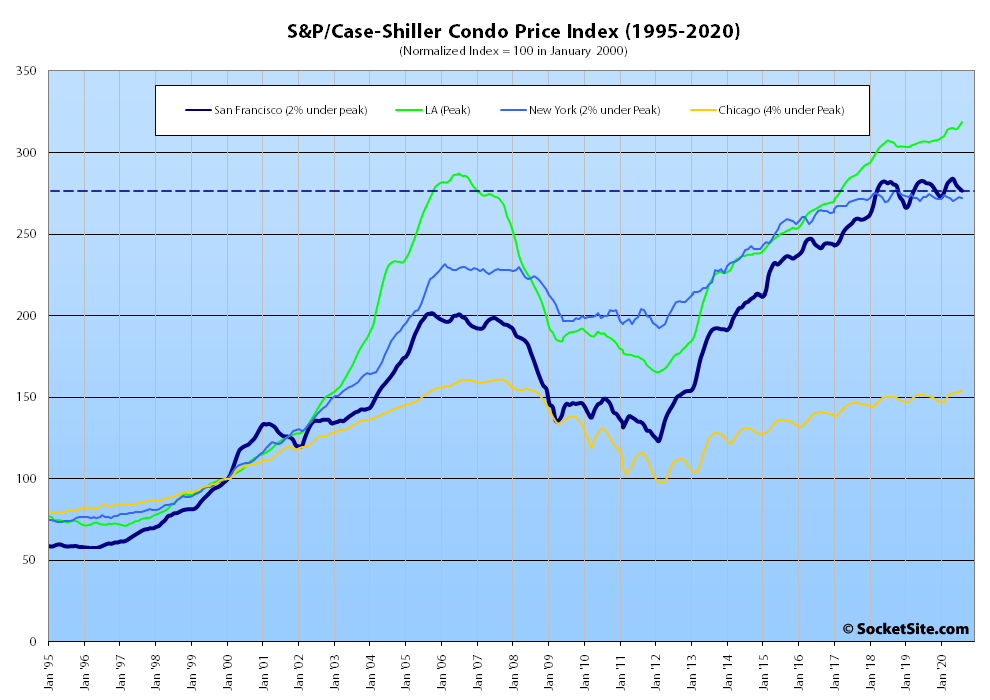
At the same time, the index for Bay Area condo values, which remains a leading indicator for the market at a whole, inched down 0.6 percent in August and was down 1.6 percent on a year-over-year basis, versus gains in Los Angeles, Chicago and Boston, with the index for condos in New York having slipped 0.3 percent and down 2.0 percent below its September 2018 peak.
And nationally, Phoenix still leads the way in terms of indexed home price gains (up 9.9 percent on a year-over-year basis), followed by Seattle (up 8.5 percent) and now San Diego (up 7.6 percent), with Chicago (up 1.2 percent) and New York (up 2.8 percent) the only two major metropolitan areas yielding smaller year-over-year gains than San Francisco.
Our standard SocketSite S&P/Case-Shiller footnote: The S&P/Case-Shiller home price indices include San Francisco, San Mateo, Marin, Contra Costa and Alameda in the “San Francisco” index (i.e., greater MSA) and are imperfect in factoring out changes in property values due to improvements versus
Condos are down slightly. However, per the last chart, they also dipped in each of the last two years, only to spike back up again (thus creating a general plateau phase). I’m not alarmed here until we get back to Spring 2017 numbers (per this chart).
Hopefully people will see these continued YoY SFR values and learn from this data as opposed to talking about precipitous falls that are not occurring. Because this trend has been going on for over a quarter now.
Exactly. This article likely won’t have the blow-up number of comments because +5% YoY for homes and -1.6% YoY for condos does not fit the “sky is falling” narrative everyone wants to believe.
But it has been consistently been pointed out that this is an index for the entire Bay Area metro, not just SF city. And what looks to be going on is a de-urbanization trend with people leaving SF city and creating demand in cleaner & greener parts of the Bay Area.
Last month when I posted the most recent apple was 10.2% below 2016 pricing. Now the most recent one was 3% below 2013!!! pricing. And if you skip the massive Berkley mansion at 35% below 2016, the next apple (Presidio heights) is 12.4% below 2016, then the Hayes Valley one at 1.5% below 2016 (though it looks like the 2016 price was already discounted to close out the sales for the building), then the SOMA loft at 12.1% below 2015 price…
Talking about averages is great, but these days talking about average appreciation around the Bay Area is a bit like talking about average wealth in a room with Jeff Bezos.
But Wilson, your argument there is the anecdotal apple versus an average of apples. When you discuss an individual apple you need to consider how much things have changed in the last six, seven, let alone 10 years. At 10 years is a roof still as good? These sorts of things. At least averages of apples will include a lot of different time lengths.
Regardless, SF itself in terms of SFRs has been mirroring this same trend, and for quite some time.
But the average of apples across the bay includes many different places. And looking at SF apples (and talking to people trying to sell here and buy elsewhere) it looks like this average across locations is combining weakness in the city with strength in more suburban areas.
I disagree. I think the weakness that’s seen in the city has been from what the combination of the condo and SFR markets looks like on a chart or on paper.
Take a well deserved victory lap. A little investor capital goes a long way to keeping the home fires burning. Not really seeing much of a slowdown in Q3.
There’s been $37.5 billion invested in later stage deals in the first three quarters, already topping last year’s $32.8 billion and within reach of the $50.9 billion from 2018. But there’s only been about $1.4 billion in seed and angel funding here through Q3, compared to full year totals of $2.3 billion in 2019 and $2.1 billion in 2018. Early venture rounds in the region finished Q3 with $8.3 billion raised, compared to $15.3 for all of last year and $14.5 billion in 2018.