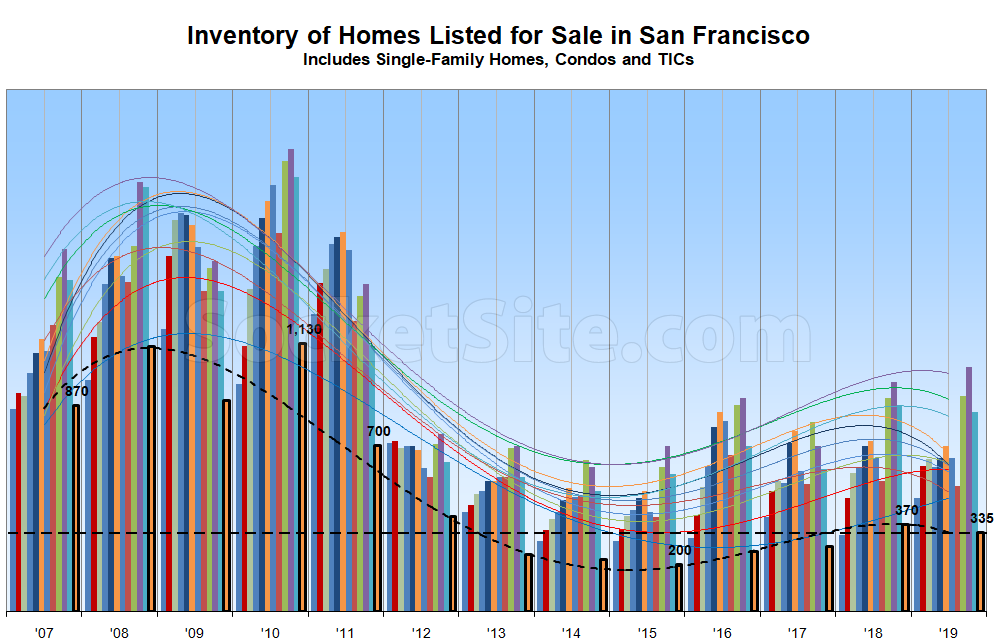
With only a handful of homes having been newly listed for sale over the past week and the seasonal culling of unsold listings – most of which are likely return to the market as “new” in the new year – having peaked, the number of homes officially listed for sale in San Francisco has dropped to 335, which is 9 percent lower on a year-over-year basis but 68 percent higher than at the same time circa 2015.
Of those homes currently listed for sale in the city, roughly 28 percent are now listed for under a million dollars (versus 38 percent at the same time last year) and 26 percent have undergone at least one price reduction (which is the same percentage as at the same time last year).
And while the total number of homes that have sold in San Francisco since the beginning of the year is on track to end the year at an eight-year low, pending sales are currently up around 20 percent on a year-over-year basis which should yield a decent uptick in January sales on a percentage basis. But keep in mind that January is typically the lowest volume month of the year.

I am not seeing one single condo for sale in SF for under a million dollars as of this moment on Realtor
And yet, there are over 50. And a few single-family homes – not including the nearly 50 which closed escrow over the past quarter with a contract, versus list, price of under a million – as well.
Perhaps it is just the Realtor App not showing the inventory when filtererd by condo under 1 million
Redfin shows 69 condos under $1M including 2 coming soon, so 67 active. Maybe you should ditch that app?
Click on name link for the Redfin listings.
I am surprised that an official Realtor(tm) app is incorrect regarding inventory, what gives with this?
Price, in terms of dollars per square feet is up year over year. So property that used to be to the left of the 1M margin is now to the right of it. If you look at average dollars per foot for condos sub 1M year over year, the difference is pretty striking. Twenty eighteen saw $916.54/ft. But 2019 has seen $1043/ft. This plays into sales volume as well. Not as many people buy when prices still climb despite all they read and hear about a falling market. Cognitive dissonance is not good for sales volume.
We’re guessing you didn’t adjust for the average age, size and location (i.e., mix) of those two data sets. Because if you did, when you start looking at the market on an apples-to-apples basis, the data paints a rather different picture.
Your criticism of the dataset of many hundreds I used versus the smattering of hand selected apples you link to, is so far from a valid take I can’t waste any more time on the subject. You sell a story on here and that’s it.
In other words, you didn’t. Because if you did, the actual trend in underlying values would look a lot more like the growing body of apples-to-apples outcomes and the broader indexes as well. Either that or the big condo developers have been cutting prices on units in San Francisco because the market is actually up by “over 10%” over the past year alone.
No. If you don’t think your readers understand the difference between a dataset and an anecdote that’s on you for everyone to see.
Unfortunately, you can’t make up for bad analysis with volume. But it can lead people into draw the wrong conclusions while appearing to be “statistically significant” and despite being fundamentally flawed.