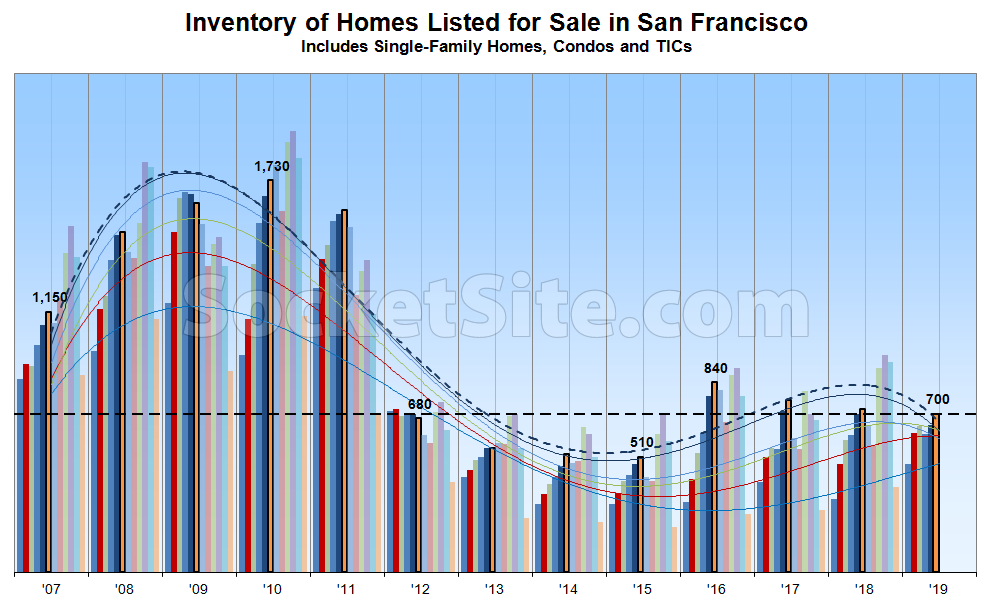
While 17 percent higher than at the beginning of the month, the number of homes on the market in San Francisco is now holding at around 700, which is 37 percent higher than in June of 2015 but 3 percent lower than at the same time last year, with the year-over-year drop being driven by a slowdown in new listing activity versus an increase in sales, the pace of which is actually down.
At the same time, the percentage of active listings in San Francisco which have undergone at least one price reduction has ticked up to 17 percent (which is even with the same time last year) while the percentage of homes on the market with a price tag of a million dollars or less has ticked up to 29 percent (which is still 2 percent points lower than at the same time last year but closing).
Expect inventory levels to start ticking down through August before jumping in September and then peaking again mid-fall.
Low interest rates, flat volume YoY versus the headlines earlier, fed cut(s) becoming likely sometime in the future. The hope for seeing that correction fades… might be up to the economy which the Fed will hold on to for as long as possible, regardless of the lack of ammo in a real downtown
Despite the fact that mortgage rates are nearing a two-year low and inventory levels have, on average, been higher in 2019 than last year, sales volume in San Francisco is actually down in 2019, not flat, and the pace of sales has actually been dropping since mid-May.
I’m in your camp — I want to see those links be true, too. But need to look at it from an unbiased perspective. The chips are lining in favor of easier lending for longer, and higher stock market for longer. It isn’t setting up for a difficult seller environment as things were looking at the start of the year (high volume YoY, high interest rates, low stock market, Fed looking to raise more). Just have to come to terms with the idea that it is high prices for longer
And yet the pace of sales is actually down in San Francisco. That’s not an opinion or desire, it’s simply a fact (as are the trends to which we have linked).
Let’s just see where the datapoint goes from here. I’m talking pricing, you’re talking about pace. I’m talking about the longer term outlook not looking great for buyers, you’re talking about May and May again
NA was talking about prices, you can’t refute that with a measurement of sales volume. Focusing on sales volume without discussing listing volume is similarly disingenuous. How many months of inventory are out there?
I always feel like this chart should be split between SFH and condo. Because there are 241 SFHs on the market and 43 are below $1mm. 9 of those are listed at 995k and up. Then 12 of the first 15 condos I looked at under $1mm were BMR or retirement. If all these were removed what would that look like?
There were 243 single-family homes on the market at the same time last year, a difference of roughly 1 percent. In 2015, there were 210 (15 percent less).
Thanks. that is helpful.
What is the reasoning for choosing 2015 as the other point of reference?
from the graph it looks like 2015 was the low for listings (and 2010 was the high).
Could this be affected by off-market pocket listings? My agent offered to send me off market listings and I’ve been surprised by the number and frequency of them. I assumed that they would be rare situations where people wanted privacy (divorce, stealth job search,..) Is this common to SF or is the sales downturn pushing more sellers to go off-market?
I am really surprised we have not had a greater push higher in the market this year. And I am not a big housing bull in SF at all. But the reaction to rates is path dependent; after last year’s dip in stocks and higher rates, I thought that stocks back basically to all-time highs, rates significantly lower with substantive talk of easing, plus all the hype about IPO’s etc- that we would have another strong push in the market here. Failure to rally…
It is curious, and I’ve wondered the same thing. Could it be: 1) the IPO effect is not as high as some real estate people have posited and, 2) Trump’s erratic behavior has spooked so many people that they just can’t pull the trigger?
Finally, what is CLEARLY driving the market is that job growth in the Bay Area has slowed way down from previous years, so there’s not a lot of NEW pressure, although there are still plenty of well compensated people to create demand.
One more….are we ACTUALLY seeing the impact of SALT deduction limits. Popular press has said that it hasn’t had the impact on the real estate that was initially feared. I wonder if any real estate folks on this board are seeing their clients consider the tax implications of large mortgages.
I’m not sure why people expected the anti-california federal tax changes (or the IPOs) to change prices instantaneously.
And after a few spectacularly misleading graphs published here, I also don’t trust SS to report the state of the market. The editor has quietly changed their narrative recently to emphasize falling sales volume instead of falling prices as if those indicators pointed in the same direction.
We’ll have to wait for Case-Shiller (with a published methodology and no conflicts of interest) to learn what actually happened.
I don’t understand what you are getting at. The Case-Shiller graph shows prices have turned down since 3rd quarter 2018. And sales volume has also been trending down since then. Where is the conflict? And what conflict of interest could the editor have involving falling sales volume?
Exactly what “conflicts of interest” do you feel beset SS?? It attracts advertisers – which, judging by what appears on my page, are all over the place – by attracting readers, who are presumably as interested in “bad” news as good. The news is mostly sourced from publicly available information – perhaps even arch rival “#$%^&+.com” – and usually linked. Case-Schiller, by contrast, is published by S&P, presumably as a profit-making endeavor, rather than as a public-service.
As for the wildly different habits of the various editors, I find the eccentricity to be part of the charm.
Well I assume there are at least as many conflicts as there are editors.
I try not to attribute malice when there incompetence suffices, but my impression is that the mistakes here trend bearish more often than chance would suggest.
Alas, each of these comments required five rounds of unpaid image classification so I am done here for a while.
Agreed. It’s setup to keep prices going up — but it may be that the low interest rates and stock market back to highs keeps things afloat longer but the market can’t bare higher prices due to affordability or the remainder of folks are simply on the sidelines until the next downturn. Either way, it’s a lot of reasons working together to set the market — and the fed sets the tone..