Having inched up 0.7 percent in June, the S&P CoreLogic Case-Shiller Index for single-family home values within the San Francisco Metropolitan Area – which includes the East Bay, North Bay and Peninsula – gained another 0.6 percent in July as did the index for Bay Area condos, lifting each to all-time highs.
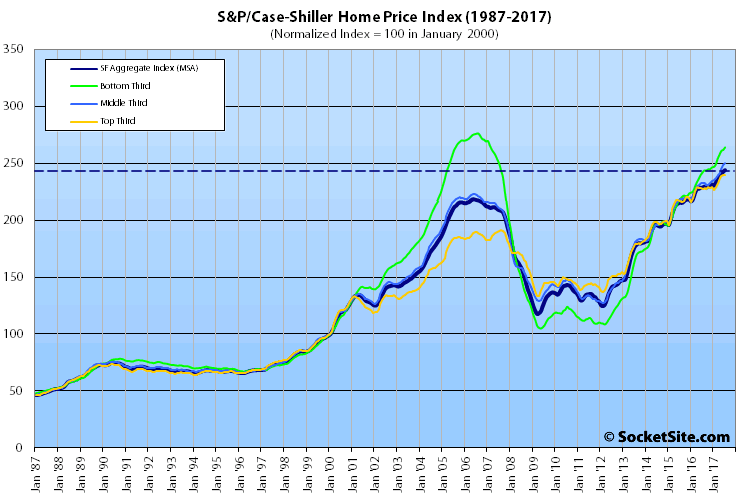
With July’s gain, the index for Bay Area single-family home values is running 6.7 percent higher versus the same time last year, driven by outsized gains at the lower end of the market.
While the index for the top third of the market gained a nominal 0.1 percent in July and is running 5.4 higher versus the same time last year, the index for the middle third of the market is 7.5 percent higher on a year-over-year basis having inched up 0.7 percent in July and the index for the bottom third of the market is 9.1 percent higher versus the same time last year having gained 0.9 percent in June.
At the same time, while the index for the top third of the market is 25.4 percent above its previous peak ten years ago, and the middle third is 12.3 percent higher, the index for the bottom third of the market has another 4.4 percent to gain before it’s back to its 2006-era peak.
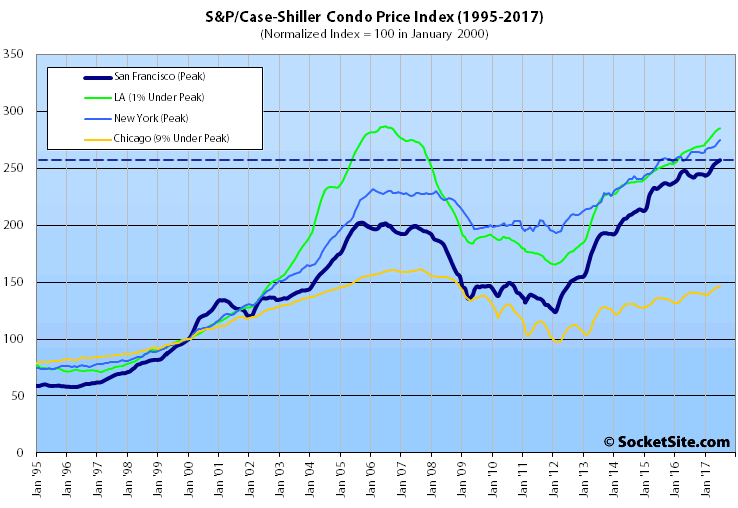
And with its 0.6 percent gain in July, the index for Bay Area condos is running 5.9 percent higher versus the same time last year and 27.2 percent above its previous cycle peak in October 2005.
For context, across the 20 major cities tracked by the home price index, Seattle, Portland and Las Vegas recorded the highest year-over-year gains in July, up 13.5 percent, 7.6 percent and 7.4 percent respectively versus a national average of 5.9 percent and a new all-time high as well.
Our standard SocketSite S&P/Case-Shiller footnote: The S&P/Case-Shiller home price indices include San Francisco, San Mateo, Marin, Contra Costa and Alameda in the “San Francisco” index (i.e., greater MSA) and are imperfect in factoring out changes in property values due to improvements versus appreciation (although they try their best).
More record highs both in single family homes and the much-maligned condo market, again disproving the oft-repeated comments over the last year or so that winter is upon us. Repeat it often enough and I suppose it will eventually come to be right.
Homes up 6.7% and condos up 5.9% over the last year. “Inch up”? I wouldn’t agree with that headline, but the numbers tell the story no matter how one wants to characterize it.
As always, don’t forget our footnote (or first sentence above): “The S&P/Case-Shiller home price indices include San Francisco, San Mateo, Marin, Contra Costa and Alameda in the “San Francisco” index.” And you might want to consider the relative performance of said segments of the market and a truly local index as well. Believe it or not, the context is important.
That “relative performance” link you supplied states that the median price paid for San Francisco homes in August last month “was 9.1 percent higher versus the same time last year.” If anything, the rest of the bay area seems more likely to be underperforming SF than the converse. But you keep sticking with that “Mark Company Index” that has proven to be as reliable as a Russian Facebook post.
As always, “Keep in mind that while movements in the median sale price are a great measure of what’s selling, they’re not necessarily a great measure of appreciation or changes in value and are susceptible to changes in mix, as opposed to movements in the Case-Shiller Index.” And while sales in San Francisco – which represent roughly 6 percent of the Bay Area market – were down an average of 9.6 percent over the past quarter, Bay Area sales were up 1.4.
But you’re right, San Francisco does appear to be leading the way.
Hehe- Socketsite is on it’s fifth year of denial… Remember that guy who used to carry around the “repent now- end is near” sign on market street? Was that the socketsite guy?? Didn’t he disappear around the time Socketsite started? Coincidence?
The bottom third of the market separating itself from the rest of the pack bares watching. Based simply on the graph it doesn’t appear to be a healthy sign overall.
You are correct and this is exactly what happened on the last downturn. The low end rises the latest and highest, and falls first and hardest. Defitely a sign the top is near.
During the previous housing bubble, the lower third separated itself and stayed higher for 4+ years before the crash. So its accuracy in telling us when something is “near” is suspect. So yes it may be pointing to another correction in the next day to three years or so. Taken with other data I do believe we are near the top of the market for the relative near term, but don’t know if it will be a plateau for a bit before heading down or resuming its rise after a year or so.
“the low end rises the latest” – I see no evidence of that being a consistently true statement from the graphs above. The low end appears to move at the same time as the other tiers but moves more, in both directions.
you are probably right….but I base my comment on personal observation and properties I know well, own or have owned in the east bay. And I agree who knows when the top will occur, but the signs are becoming increasingly clearer its coming.
there was a recent article on regional growth of the state. While the bay area has led recently on a % basis, the growth rates are now accelerating more inland, which basically tells me the coastal money and development is peaking and moving inland, like a wave. like it always does. this tends to occur as tops in the cycle are occuring. I liken it to the DTO crane factor, which is booming right now. This occured exactly during the last two cycles. I suspect this time will be the same. Patience and cash building today I believe will pay well in the future for both stocks and RE.
I agree that money is moving inland. There is more upside outside the areas like SF that didn’t fall as far when the bubble burst. I don’t see much upside in SF right now over the short-term (one of the reasons I was willing to move to Reno and sell my unit in SF).
Except that, as shown in the chart, in the last boom the low end rose the earliest, not the latest.
Given the context of how tech has gone, that makes a lot of sense. I think everyone would agree, the rich of today, are much different than the rich of 99/2000.
1551 Filbert #4, 1 br 1 ba sold for $910,000 in March 2016, just sold again for $975,000, up 7.1% in the last 18 months (a little better than the Case Shiller broader numbers). Rumors of the SF housing market demise have been greatly exaggerated. Really, you can look at just Case Shiller to get a pretty accurate sense of things.
Anon – isn’t that supporting the low end rising? Pretty clear from the numbers and from looking around, the competition at the low end of the market is quite fierce as that’s all that people can afford. The graph above shows that as well.