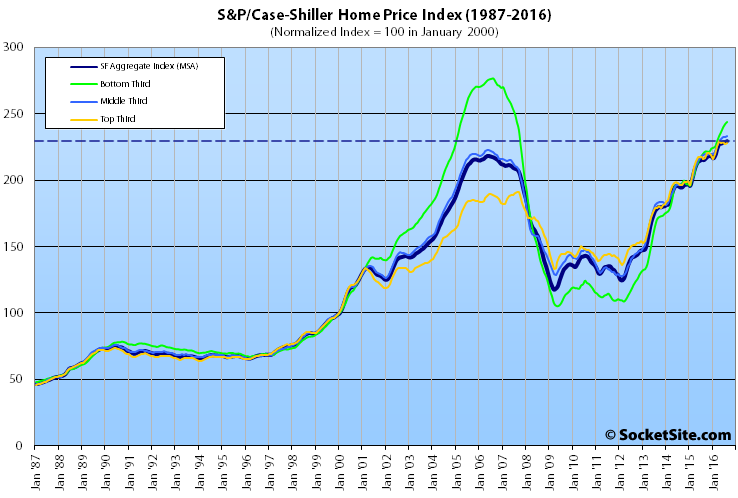
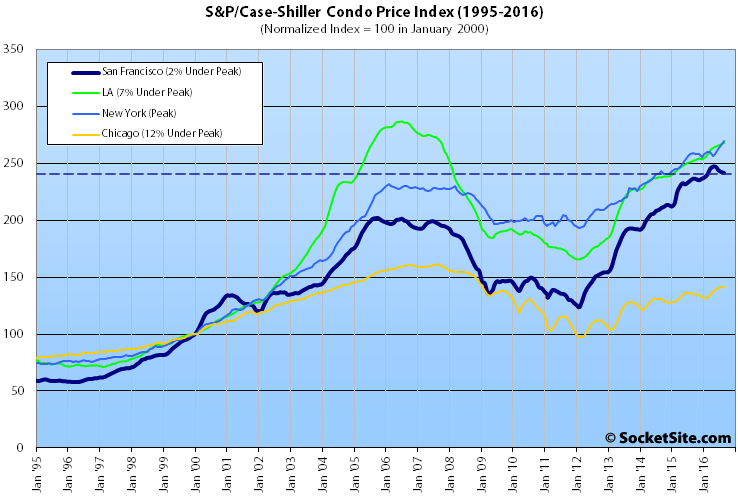
Having stalled in July, the Case-Shiller Index for single-family home values within the San Francisco Metropolitan Area inched up 0.4 percent to a record high in August, driven by gains at the bottom end of the market, while the index for Bay Area condo values slipped for the third month in a row.
On a year-over-year basis, the aggregate index for area single-family homes was up 6.7 percent in August versus 6.0 percent in July, the first uptick in over a year, led by a 10.6 percent year-over-year gain at the bottom end of the market (which ticked up 0.6 percent from July to August) versus 5.6 percent at the top (which inched up 0.2 percent in August).
That being said, the index for the bottom third of the single-family home market remains 11.8 percent below its 2006-era peak, while the middle of the market is 4.5 percent higher and the index for the top-third of the Bay Area market is running 19.2 percent above its previous cycle peak which was recorded in August 2007 but has slipped 0.7 percent over the past four months.
And while the index for San Francisco area condo values remains 19.6 percent higher than its previous cycle peak in October 2005, it has slipped for the third month in a row, shedding another 0.4 percent for a total decline of 2.2 percent since May and a year-over-year gain of 2.7 percent, the smallest year-over-year gain since the second quarter of 2012.
The index for home prices across the nation ticked up 0.5 percent from July to August and is now within 0.1 percent of its July 2006 peak while the year-over-year gain ticked up to 5.3 percent.
And for the sixth month in a row, Portland, Seattle and Denver reported the highest year-over-year gains, up 11.7 percent, 11.4 percent and 8.8 percent respectively, but the pace of gains for all three have slowed.
Our standard SocketSite S&P/Case-Shiller footnote: The S&P/Case-Shiller home price indices include San Francisco, San Mateo, Marin, Contra Costa and Alameda in the “San Francisco” index (i.e., greater MSA) and are imperfect in factoring out changes in property values due to improvements versus appreciation (although they try their best).
After reviewing the data, I offer an alternative headline:
“Bay Area House Prices Hit Record High With 6.7% Year-Over-Year Gain, While Condos Show Modest 2.7% Year-Over-Year Gain”
I don’t doubt that a slowdown will come some day – maybe soon – but the numbers simply don’t support the conclusion that it is upon us. I will be cheering when it arrives.
If you look at the historic CS data for Ess Eff, declines all summer long translate to “fasten your safety belts”. I don’t think the canary has keeled over, but he is making wheezing sounds.
The historic CS data I’m looking at is for the aggregate, so YMMV.
While year-over-year comparisons are valuable when trying to spot highly seasonal trends, such as with sales, it misses eleven months of movement when looking at the directionality of values/prices.
That being said, here are the past twelve months of year-over-year stats for the condo index reported above:
12.2%
11.4%
10.1%
11.0%
12.0%
11.5%
9.0%
7.6%
6.2%
5.3%
4.0%
2.7%
But more significantly, the index has shed 2.2 percent over the past quarter with the first three-month decline since 2012.
If you don’t see any evidence of a slowdown, you’re really not looking at the numbers/data at all.
A record high for houses, and condo YOY prices are still up more than the overall inflation rate, albeit less than the tear of the past few years. You can call that a slowdown if you’d like, but I sure wouldn’t. Heck, I guess you could say we were in a slowdown 11 months ago when condos saw only an 11.4% YOY gain rather than the 12.2% gain the prior month. I suppose “downturn” is a better word than “slowdown” when I note we are not yet there.
Believe me, when the numbers truly indicate a downturn, I will be the first one saying “told you so” as I said over a year ago that buying was risky. So far, I’ve been wrong. By the way, I do appreciate SS’s keeping an eye on the various indications.
The three times we’ve seen summer slowdowns (negative month-to-month) are 1990, 2001, 2006. The 2001 dip was the only one that did not end in tragedy (again, CS-HPI data for Ess Eff). The key is the June-July-August downtrend.
the market appreciated in SF from 2006-2009, before crashing in 2009-2011. 3 year runway is damn good
If you segment the San Francisco market, it actually started to turn in 2006.
That’s akin to your broker buying a stock for your portfolio three months ago at a price that was 2.2 percent higher than today, but arguing that you’re actually up, and there hasn’t been any downturn, because it’s still worth 2.7 percent more than at the same time last year.
i would agree with my broker if he said that because i dont look at 3 month variation. i wouldnt be happy with 2.7% appreciation in stocks, but its better than inflation right now.
And that’s akin to saying there wasn’t actually any financial downturn in 2008, because you have a long-term outlook and didn’t look at your portfolio again until 2013.
it goes both ways. you could also argue if my stock was down 1% today that the market is turning, but its meaningless. 3 months to me is meaningless. one year for an investment is not.
BTW, i agree that the market has softened dramatically and will prob turn negative over next 1-2 yrs, based on your data showing the decreasing yoy changes. i just dont buy 3 months arguments
Yeah, the CSI condo index dipped a bit for a few months in early 2014, then proceeded to shoot up 20% over the next two years. 3 months of numbers don’t mean anything. I’m not saying there is no slowdown or downturn, no way, no how. I’m just saying the numbers do not support making that call now. Particularly when the CSI house index just reached an all time high, and MLS median and avg prices are also at peaks. None of these is perfect, but you can’t cherry pick either.
At least be genuine with the data we have. The “few months” dip in 2014 was two months and under a percent. And while median trends are a horrible measure, the median sale price in San Francisco has actually been trending down for a quarter as well and was lower on a year-over-year basis last month, the first substantial year-over-year decline since 2011. And of course, there’s the data for new construction.
Since you brought up being genuine with the data — I mentioned MLS numbers, and you countered with Corelogic’s numbers, which are not co-existent with the MLS, and with a non-transparent “pricing index” of (as far as I can tell because there is no detail) non-MLS new sales.
And the CSI condo numbers for March – June 2014 were 202.133, 200.6, 201.5 and 202.09. That’s 3 months where the numbers were lower than the start month. “Dipping for a few months” is an accurate summary of that. And then the index shot up to 247.45.
I’m happy to have someone call BS if I fudge on sources or analysis, but don’t pretend to call me out where I didn’t fudge at all,by relying on misdirection and mischaracterization.
Corelogic reports all sales, of which MLS transactions (which are self-reported versus based on the actual transfer of deeds) are a subset. And while the new condo “pricing index” is far from a panacea, the trend in sales is more telling with respect to a slowdown.
As far as Case-Shiller, the condo numbers for March to June of 2014 were:
199.2201216
201.9693935
204.8946423
205.6073486
You’re quoting seasonally adjusted numbers, which in this case, you really shouldn’t.
“You’re quoting seasonally adjusted numbers, which in this case, you really shouldn’t.” Why? There is certainly a seasonal effect so that would be the more useful index. Regardless, then refer to the non-SA numbers for Sept. 2013 to Jan. 2014:
192.63
192.62
192.08
192.05
191.56
Four months where the condo index number was below the initial month. Then the index shot up to 246.9. Same point, which is that referring to some small month-to-month sample tells us nothing. There was no slowdown in early 2014 even though the monthly numbers may have hinted at it. There may be a slowdown now. Or we may be poised for further gains. But you can’t tell from the numbers we have, which are a mix of record highs and short term slight dips.
And like I said, I noted the MLS numbers, you responded with Corelogic, which is not co-existent with the MLS. That’s fine — if you really want to understand things, one should consider everything that is relevant. But don’t suggest that two things are the same when they are not.
Call us crazy, but we consider changes of under 0.1 percent to be no change at all. Adjusting for seasonality can help explain why the numbers are moving, but it doesn’t mean the numbers didn’t actually move. And while we generally eschew median based trends, at the very least we’re going to use the best source of said data versus a self-reported subset.
I think socketsite gets more realtor ads when the market looks soft…buying opportunity!…which effects the lingo chosen for the headlines. Look, man’s gotta put food on the table whilst we entertain ourselves.
Hey, I’m obviously a big fan of this site. I appreciate the info no matter how it is spun.
That’s sincerely appreciated, but we’re anti-spin. Instead, we’re data driven and tell it like it is, which we realize can make some people uncomfortable.
Argue it’s simply a seasonal drop (FYI – the seasonally adjusted numbers would suggest the condo market has been on the decline since March and dropped over 4 percent), or a brief dip which is certain to rebound (insert reason here), but to state the condo index isn’t actually in decline is factually wrong.
The Seasonally Adjusted numbers are a bit ridiculous. The housing market dynamics behave much differently depending on whether it is an up year or a down year. For the sake of sanity JR, please use NSA numbers. I’ll agree with JR that three down months don’t tell us much; however (sorry, my caps logic is sticking), THREE DOWN SUMMER MONTHS means anywhere from a 10% to 45% drop in the home price index. Again, my generalizations are from CS home index (for Ess Eff Bay Area) as the CS condo index does not cover the 1990 peak. In conclusion, I’ll say that at a minimum, we’ve got at least another 8% drop. YMMV.
There’s nothing magically significant about short term numbers in the summer vs. any other time. You don’t like seasonally adjusted numbers (even though they put them out because the housing market is seasonal), fine. Non-SA CSI house numbers were down (slightly) the three summer months of 2014. They’ve risen 18% in the two years since then to a record high. Non-SA CSI condo numbers were down the three summer months in 2011 (and for a few months beyond that), and then condo prices nearly doubled over the next five years.
These types of numbers over a very short period simply don’t reveal anything significant. The condo index is down a little the last three months, and the house index has hit new record highs. Clear evidence of a slowdown? Not at all. Suggestions that we may be in the early days of a slowdown? Fair enough. Suggestions that the record highs may keep coming? Equally fair enough. Drawing broad conclusions about pricing trends from a tiny slice of selective data simply isn’t valid. I do this for a living. Anyone who tried to claim “condo values on the decline!!!” based on these data would be laughed out of court. It’s all fun, and this is just a blog. But let’s not pretend you can draw any conclusions about price declines that are even close to valid. With record highs in the CSI home index?
If we see continuing declines in these numbers, then I’ll readily agree that “yep, that was the start.” I’ve been warning it could come for about a year.
You are correct that this is not “evidence of a slowdown”. This is what we call “leading indicators”. The canary in the coal mine, that tells us the slowdown is probably coming soon, or perhaps even the crash. Kind of like Apple’s first year of declining revenues since 2001, or Amazon’s big miss today, or Twitter’s layoffs, or the Living Social unicorpse.
JR said: There’s nothing magically significant about short term numbers in the summer vs. any other time… Non-SA CSI house numbers were down (slightly) the three summer months of 2014.
You had me worried for a second, then I checked the Case Shiller spreadsheet. There were only two months of (minimal) consecutive declines in 2014. Three consecutive months of summer decline will show a strong downturn at the beginning of summer (which indicates a significant weakening over five months as the index itself encapsulates a three month moving average). Up markets have a strong traditional selling season (post Superbowl through the beginning of the school year). Three bad months at the end of this selling seasons indicates the market have weakened and WILL take a dive. The three big crashes on the C/S Ess Eff HPI were predicted by the summer phenomena of three down months. The summer season does matter.
You’re right that I am drawing “broad conclusions” from this condo data. If the CS Home Price Index had shown a similar weakness, I would be pounding the table. Alas, we’ll have to keep the home fires burning with a bit of speculation during the winter.
So the second derivative of prices is now negative, but the first derivative is still positive.
No. The first derivative, or at least its slope, turned negative, which is the entire point.
I thought the index for single family homes “inched up 0.4 percent to a record high in August”. Does that mean that prices are rising? (Albeit at a lower rate of increase)
Note: the slope of the first derivative is the second derivative.
The discussion to which you replied was focused on the index for condos, not single-family homes. But yes, inching up does mean rising, as we reported above.
“If you don’t see any evidence of a slowdown, you’re really not looking at the numbers/data at all.” – ed
It’s illuminating to observe how so many people in the FIRE sector – a sector that depends entirely on math (well, and confidence…) – actually are innumerate.
“It is difficult to get a man to understand something, when his [income] depends on his not understanding it.” – Upton Sinclair
I see a choppy top coming but interest rates will maintain low (under 4.5%) through HRC’s 1st and 2nd terms.
until the tech companies run out of steam, the Bay Area market will always have superior buoyancy -and- London’s Brexit (and the new non-EU laws yet to written) makes SF a safer, more predictable place park to gobs of foreign money.
We all know Donald Trump is going to win, the economy will boom as a result, and real estate will continue its relentless upward march. I’m working on the purchase of a 4-unit building (my first purchase in 2 years) and see nothing but upside appreciation and high yields into the future.
for the lawls