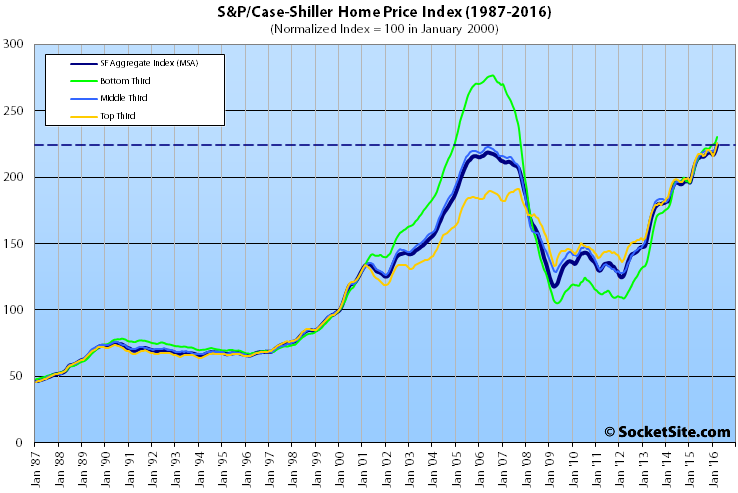
With solid gains across all three price tiers, the Case-Shiller Index for single-family home values within the San Francisco Metropolitan Area gained 2.3 percent in March and is now running 8.5 percent versus the same time last year, hitting a new all-time high and surpassing the previous cycle peak recorded in May of 2006 by 3 percent.
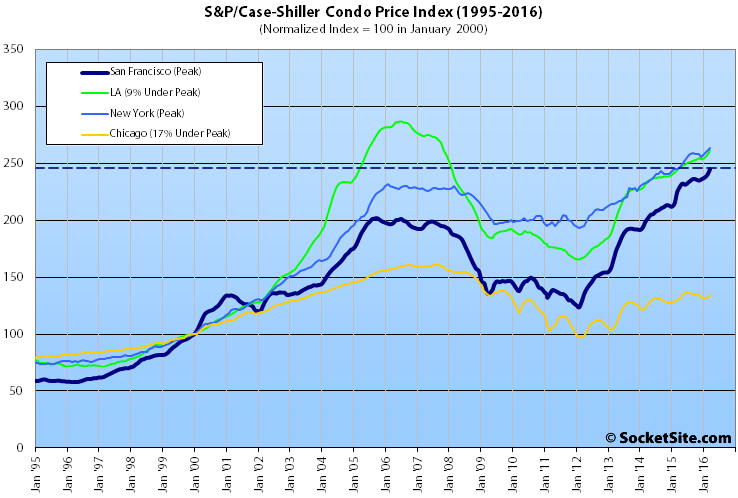
The index for Bay Area condo values hit a new all-time high as well.
That being said, while the index for single-family home values at the bottom third of the market gained 1.9 percent in March, is running 13 percent higher versus the same time last year, and has more than doubled since bottoming in 2009, it remains 17 percent below its 2006 peak.
The middle third of the market, which is now even with its 2006 peak for the first time in ten years, gained 2.0 percent in March, is running 9.2 percent higher versus the same time last year and has gained 73 percent since 2009.
And the index for the top-third of the market gained 2.6 percent in March and is running 7.3 percent higher on a year-over-year basis and 17.9 percent above its previous cycle peak set in August of 2007, having gained 69 percent since bottoming in 2009.
The index for San Francisco condo values gained 2.1 percent in March to hit a new all-time high which is 9.1 percent higher versus the same time last year and 21.4 percent higher than its previous cycle peak in October 2005.
The index for home prices across the nation ticked up 0.7 percent from February to March while the year-over-year gain slipped from 5.3 percent in February to 5.2 percent and remains 4.2 percent below its July 2006 peak.
Portland, Seattle and Denver reported the highest year-over-year gains, up 12.3 percent, 10.8 percent and 10.0 percent respectively.
Our standard SocketSite S&P/Case-Shiller footnote: The S&P/Case-Shiller home price indices include San Francisco, San Mateo, Marin, Contra Costa and Alameda in the “San Francisco” index (i.e., greater MSA) and are imperfect in factoring out changes in property values due to improvements versus appreciation (although they try their best).
I’m not an expert in the CSHPI – so perhaps Jake or someone more versed in it than I can clarify – but I’m assuming the prices are localized to the specific MSA (i.e. 200 means Bay Area homes are 2x what they were in 2000, not 2x what the average national home was).
And so, if that’s the case, then I wonder how useful this is, since one of the underlying premises – that home prices can’t rise much faster than incomes – doesn’t seem to really apply at the local level….they still can’t rise much more than incomes, of course, but local incomes can rise much more than national incomes. The various “(un)affordabilty” indexes account for this, and show similar patterns, but much less extreme.
So this appears to sync with the much smaller area around where I live that I keep an eye on. Prices continue to to rise – amazes me. There may be some whispering leading indicators of things starting to level off or turn at some point. But those arguing that has already happened really don’t seem to have much support in the evidence. I still think lower prices a couple years from now are more likely than higher prices, but at present, it seems to be onward and upward.
Also, a note about passing the previous 2006 peak – inflation has hit at about 17% since then, so we are still below the previous bubble peak for houses in real terms by a fair amount (above it for condos by a tad).
Fascinating to think about re: 06 through today. I bet almost nobody believes that an 06 buyer has not made a killing. It can be impossible to have conversations like this with people, they become so invested in the idea that their Bay Area home is a can’t-miss win over any time horizon.
It depends upon where you bought. If you bought in the Mission, Bernal, Noe in 2006 you are sitting pretty.
Yuppers
Many people also don’t realize that when adjusted for inflation, the S&P 500 is finally back to the same level as 16 years ago. Yep, if you somehow held on through the huge drawdowns, that’s zero real return since 2000. Inflation combined with zero interest rates is government sanctioned theft from the poor for the wealthy.
So prices are not falling according to Case Shiller. The three month trailing aspect is understood, but I thought this would show decline still. Change was seemingly in the air in February and early March.
A key line from our regular footnote: “The S&P/Case-Shiller home price indices include San Francisco, San Mateo, Marin, Contra Costa and Alameda in the “San Francisco” index.” And while slower to recover, the East Bay market has recently been on a relative tear.
Yes, that’s true. It looks like a flight to affordability/quality of housing stock, particularly with regard to Oakland. But the same can be said for single family homes in decent areas of SF that are in the mid 1Ms and under. Or any 2br condo under ~1M.
Yup, another very strong month. As suggested some leading indicators point at trouble ahead, but then again they did 12, 18. 24 months ago also…Up up and away, it seems..
Which leading indicators in specific?
The SF – Chicago relative spread since ’12 is interesting. I wonder how much is related to macro “Chicago is generally an unsound place to invest” worries. Probably more rust-belt drag in the greater MSA.
Probably related to the geographic barriers to expansion. Chicago only has one: the lake. The SF Bay Area on the other hand is mostly locked in by mountains and the bay. For greenfield expansion you end up in Antioch, Brentwood, Hollister, Tracy, etc. and those places lie outside of the SF MSA. Also Chicago has a lot more centrally located brownfield sites ready for inexpensive redevelopment.
It was a three years rippling along the top last time before the collapse. Expect the same this time. Housing doesn’t hang a fast U-turn.