According to a Coldwell Banker accounting of home sales across the U.S. which closed escrow with contract prices of over a million dollars in 2015, the city of San Francisco tallied the third most million dollar sales in the U.S., behind only New York and Los Angeles and followed by San Jose.
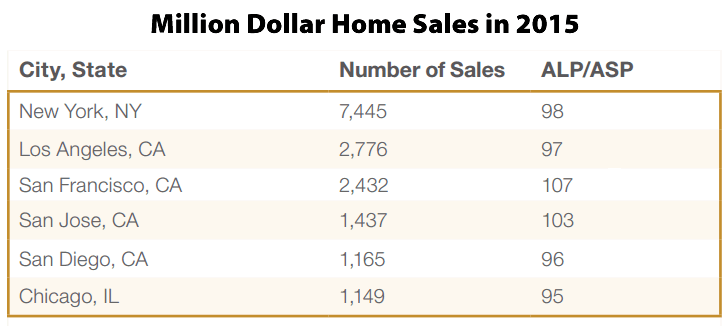
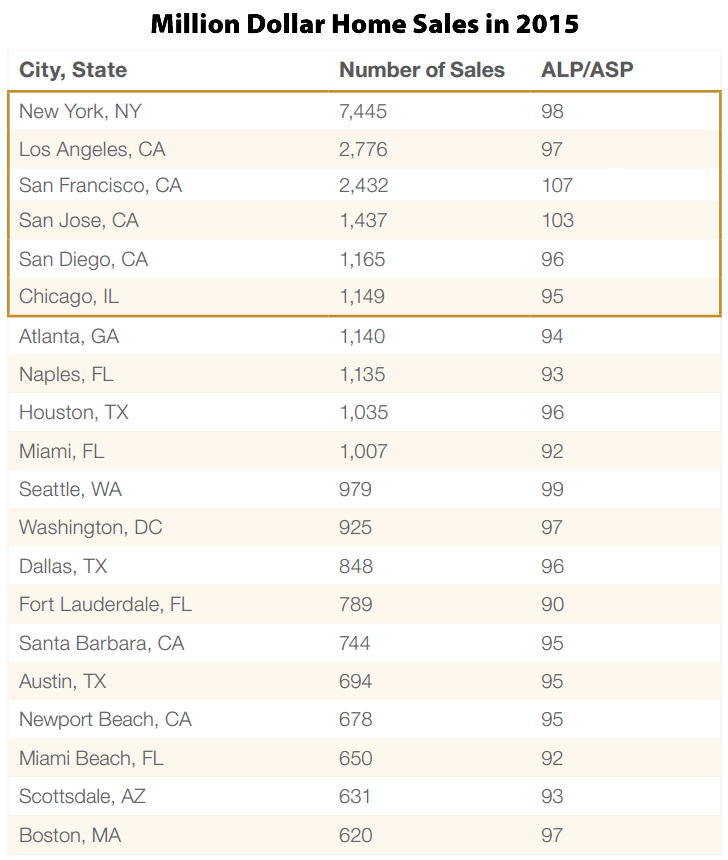
The top ten U.S. cities with respect to million dollar home sales (and number) in 2015:
1. New York, NY (7,445)
2. Los Angeles, CA (2,776)
3. San Francisco, CA (2,432)
4. San Jose, CA (1,437)
5. San Diego, CA (1,165)
6. Chicago, IL (1,149)
7. Atlanta, GA (1,140)
8. Naples, FL (1,135)
9. Houston, TX (1,035)
10. Miami, FL (1,007)
For home sales above $5 million, San Francisco dropped to seventh place, with 66 sales versus 929 in New York, and Beverly Hills (113), Los Angeles (111), Miami Beach (95), Naples (87) and Aspen (86) between. Atherton, the next closest Bay Area city, recorded 40 sales of over $5 million and ranked fifteenth.
And in terms of home sales of over $10 million, San Francisco tied with Newport, California for twelfth with 11 sales apiece versus 211 in New York, 38 in Beverly Hills and 32 in both Los Angeles and Aspen.
Give the geographic and population sizes of these cities, that’s particularly striking (galling).
Yeah. I used to think of San Francisco as roughly on par with Boston in terms of population, size, and prosperity
population is roughly Baltimore
wealth concentration of SF+SV is a bit ahead of Wash DC + VA/MD suburbs
boston is nowhere near SF in terms of wealth
I think it used to be. But not any more.
Back in the day I posted on this site about the large amount of plus one million dollar sales in Newport Beach and was met with disbelief. These numbers show I was not “making things up” and considering the small population of Newport, the strength of that market remains astonishing.
Using land area and 2014 population statistics from Wikipedia:
$1M sales per 1000 residents: SF (2.85) NY (0.88) LA (0.71)
$1M sales per square mile of land: SF (51.7) NY (24.6) LA (5.9)
10019 New York, NY 568 97
10011 New York, NY 549 99
10023 New York, NY 503 98
92037 La Jolla, CA 452 94
94539 Fremont, CA 426 101
Fremont?
Curious that none of the SF – or Peninsula – ZIPs made the list.
Speaking of dotcom, What It Takes to Win an Offer near 94539 on Redfin reads like a repeat of the early aughts: waived appraisal contingency, reduced inspection and loan contingencies… seller accepted our pre-emptive offer… had a loan contingency only and we were beat by a non-contingent offer and higher price… 15 offers on this home the sellers agent indicated that we were the 3rd lowest offer
SF is for poor rich people.
I prefer prole millionaires. Rich oligarchs give SF a pass it seems
Yes I agree 😀
$an Francisco
Of course, $10 million homes in locations like Aspen are third or fourth or tenth homes. Recall John McCain not even knowing how many homes he had.
Another fun statistic. If all these homes sold at the bare minimum of $1million per sale (and many were probably more), the city would be collecting roughly $18 million in transfer tax.
Are the NY and LA numbers measures of million dollar sales in the those metro areas? Seems like the SF and SJ numbers should be combined as they are in one metro area.
“average-list-price to average-sale-price ratio – A new component to the data this year — average-list-price to average-sale-price ratio (ALP/ASP) —”
OOps. Surely that index is wrong? (transposed?) 107% list price vs sales price for SF..?
“New this year – average-list-price to average-salesprice ratio (ALP/ASP). A high percentage number indicates sellers are paying close to or at list price, suggesting a high-demand market.”
Yes it’s the complete opposite of what would make sense….guess realtors aren’t math whizzes.