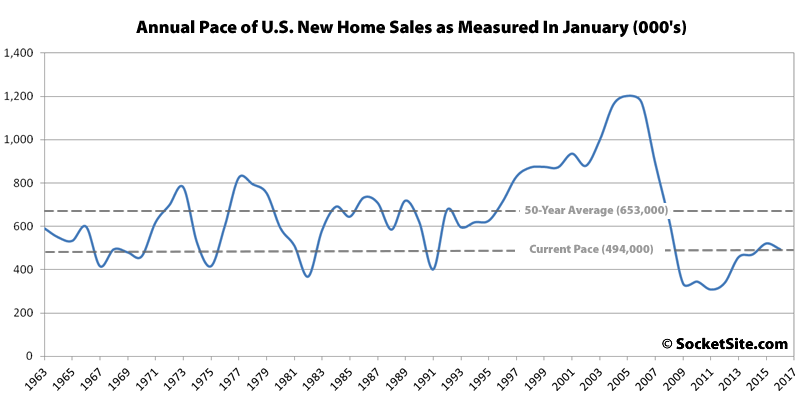
The seasonally adjusted pace of new single-family home sales across the U.S. fell 9.2 percent from December to January. And at a run rate of 494,000 sales, the current pace is 5.2 percent lower versus the same time last year.
The annual pace of new single-family home sales as measured in January has average 653,000 over the past fifty-two years and peaked at 1,203,000 in 2005, 143 percent higher than last month.
And in terms of inventory, the number of new single-family homes for sale across the county is currently 238,000, up 2.1 percent from the month before, 14.4 percent higher versus the same time last year, and the highest inventory of unsold new homes as measured in January since 2009.
In the West, the pace of new single-family home sales tumbled 32.1 percent to an annual pace of 110,000 sales, 24.1 percent lower than the pace at the same time last year.
At this point it’s only noise in the data, particularly because figures are often revised up later. Also it’s national, and of limited relevance to local conditions.
“…because figures are often revised up later.”
Figures are more frequently revised down later.
Maybe you missed the part about the Western region leading the decline with a 32% tumble, 24% year over year. While the Northeast and South actually edged higher, according to more detailed data. Hm… could it be the record low affordability, unicorns running out of magic fairy dust, or crackdown on smurfing?
Sales for all of 2015 averaged 501,000 on an annual basis. 494,000 (annualized) for one month is less than the 2015 average but certainly nothing to get excited about. Pet peeve of mine that the headline here is “slumped”, the headline in NYTimes is “plunged”. Meanwhile, the reported January figures dropped 3.5 percent from last year’s average, but there is enough variability in month to month statistics that this means precisely nothing. Call me when something REALLY changes.