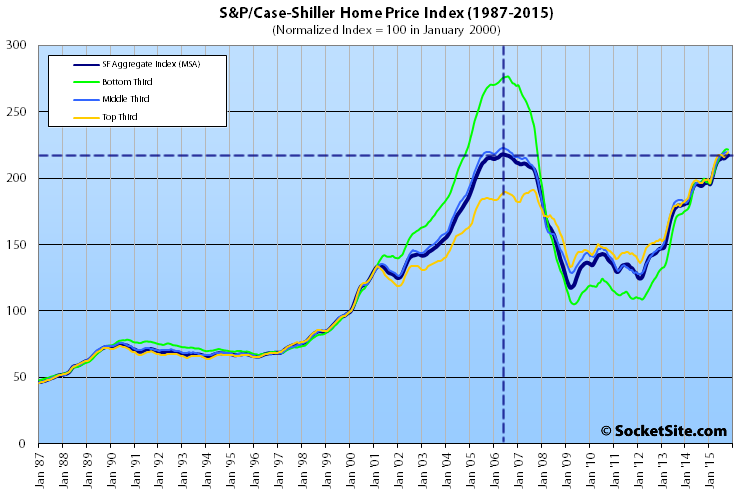
Having ticked up 0.3 percent in November, the Case-Shiller Index for single-family home values within the San Francisco Metropolitan Area is back to the all-time high set in early 2006. The index has gained 61 percent since January 2010 and is now running 11 percent higher versus the same time last year.
The index for the bottom third of the market was unchanged in November but is running 12.4 percent higher, year-over-year, while the index for middle and top thirds of the market ticked up 0.1 percent and are running 10.5 percent and 10.9 percent higher versus the same time last year, respectively.
Single-family home values for the bottom third of the market in the San Francisco MSA have more than doubled since 2009 and are back to November 2004 levels (20 percent below an August 2006 peak); the middle third is back to February 2006 levels (2 percent below a May 2006 peak); and home values for the top third of the market have hit a new all-time high, 15 percent above the previous cycle peak recorded in August of 2007.
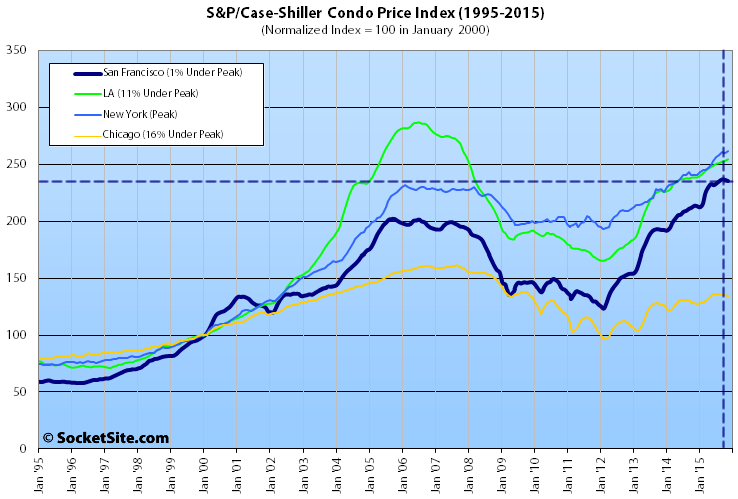
At the same time, San Francisco condo values slipped for the second month in a row, dropping 0.4 percent in November. The index for condo values has dipped 0.6 percent from an all-time high in September but remains 10.1 percent higher versus the same time last year and 16.5 percent higher than in October 2005 (the previous cycle peak).
The index for home prices across the nation gained 0.1 percent in November and is running 5.3 percent higher on a year-over-year basis but remains 4.8 percent below its July 2006 peak.
Our standard SocketSite S&P/Case-Shiller footnote: The S&P/Case-Shiller home price indices include San Francisco, San Mateo, Marin, Contra Costa, and Alameda in the “San Francisco” index (i.e., greater MSA) and are imperfect in factoring out changes in property values due to improvements versus appreciation (although they try their best).
Ok, one interesting fact about this chart is that all 3 tiers are moving in lockstep. This means that prices are driven by the real ability to purchase, not a market incentive towards one demographic or another. I think this is great news, even though affordability is the bigger picture here.
What SFS(fkal) said^^^ However, it doesn’t preclude all three tiers from decreasing at the same time but it does show general strength and a lower probability of a “bubble burst event” with massive mean reversion for any one tier. that is to say that if you hanging around waiting for the sky to fall before buying you may be waiting a long time.
Lastly, I think there is a “super premium” tier that exists in SF that isn’t really captured in these C/S charts. That market is probably showing higher by my gut check feel of the market.
I think you’re misinterpreting the situation. The subprime bubble drove the tiers far apart because any average joe could borrow way above what their income would normally allow and bid up the price of RE. But any potential frothiness now isn’t due to joe lunchbox buying a house at 10x income.
The risk factors now are tech, interest rates and foreign investment. And these apply across all three SF tiers. Tech workers in the $100k range are likely to be buying the the “low” tier.
Also Bloomberg just reported a slowdown in the ultra high end. They even got an unusually candid quote from a local RE brokrage:
“Even in San Francisco, where the market for luxury properties remains strong, the inventory of listings for $2 million or more jumped in October to a record level, said Patrick Carlisle, chief market analyst for Paragon Real Estate. Both buyers and sellers were getting increasingly worried about the direction of the economy, he said.
“More sellers are jumping in and more buyers are holding off because they’re worried about where the volatility is going,” Carlisle said.”
Condos prices have gone down SLIGHTLY because inventory has risen for condos.
Why? Because 1000’s of TIC’s have finally turned into condos from the TIC to condo bypass law that happened 2 years ago. And they are just now finally turning into condos
Condo prices lower is just a short blip caused from politics from a few years back that created a short term exodus of new condo owners who have had their places for years and were holding off to sell as a condo. Definitely not a long term trend.
Exciting times. Eagle Vista Equities is buying up foreclosures and flipping them, in Ess Eff and beyond. For an example, see: 1448 Oakdale Ave.
I think the Bloomberg article reflects what I’ve been seeing since probably last summer. There’s a major slow down at the very top end of the market. Moneyed buyers don’t want to buy at peak market, so they’ve been shying away from the $10+ million homes.
The $4-7 million market seems fine for now, but there will be more pressure on sellers to come down to that level this spring. My guess is there will be something of a stalemate between sellers and buyers which could also contribute to rising inventory and slowdown of sales.
Over here in D7, I expect sellers to hold fast to pricing and just pull homes that don’t sell in the spring market. That said, the off-market sale of 2865 Vallejo is a good comp for sellers. It apparently had an increase of about 7% in the past year IF it was apples to apples. It was totally renovated before the fall 2014 sale. Basically, anything over 10 will probably sit… anything remodeled in the sweet 4-7 range will move.
The tech bust, stock correction, and Chinese capital controls are going to crash this party hard.