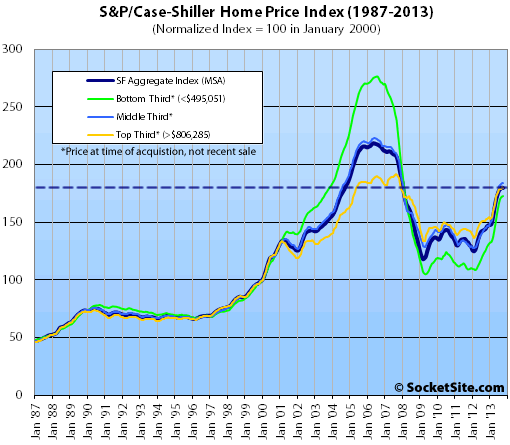
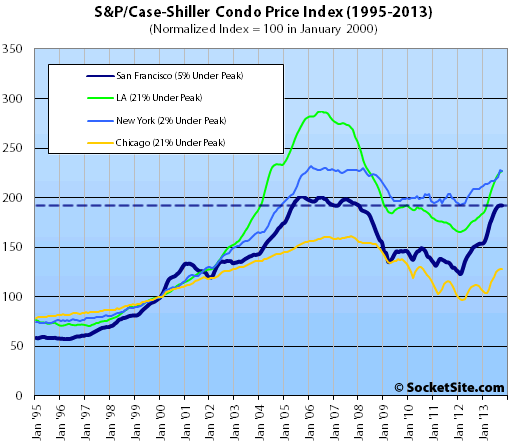
Having been slowing for five months following the record setting gains recorded in April and May, single-family home values in San Francisco ticked down in October according to the S&P/Case-Shiller Home Price Index, the first decline since February of 2012. At the same time, San Francisco condo values were flat in October, the first month without a month-over-month gain in almost two years.
Up 24.6% year-over-year, the index for single-family home values in the San Francisco MSA recorded a 0.2% decline from September to October 2013 and ticked down to 17.8% below a May 2006 peak.
For the broader 10-City composite (CSXR), home values gained 0.1% from September to October and are up 13.6% year-over-year but remain 20.3% below a June 2006 peak.
“Home prices increased again in October,” says David M. Blitzer, Chairman of the Index Committee at S&P Dow Jones Indices. “Both [the 10 and 20-city] Composites’ annual returns have been in double-digit territory since March 2013 and increasing; now up 13.6% in the year ending in October. However, monthly numbers show we are living on borrowed time and the boom is fading.
“The year-over-year figures increased slightly from last month. Thirteen cities and both Composites posted double-digit annual returns. Cities at the top of the range (Las Vegas, San Diego and San Francisco) saw smaller annual increases. On the other hand, cities that have been relatively underperforming (Cleveland, New York and Washington) saw their annual gains grow. Miami showed the most improvement. Chicago recorded its highest annual rate (+10.9%) since December 1988. Charlotte and Dallas posted annual increases of 8.8% and 9.7%, their highest since the inception of their indices in 1987 and 2000.
“The key economic question facing housing is the Fed’s future course to scale back quantitative easing and how this will affect mortgage rates. Other housing data paint a mixed picture suggesting that we may be close to the peak gains in prices. However, other economic data point to somewhat faster growth in the new year. Most forecasts for home prices point to single digit growth in 2014.”
While prices actually ticked up for the lower two tiers of San Francisco properties in October, a decline at the top offset their gains for the index as a whole.

The bottom third (under $495,051 at the time of acquisition) gained 0.4% from September to October (up 37.5% YOY); the middle third gained 0.2% from September to October (up 26.9% YOY); and the top third (over $806,285 at the time of acquisition) fell 0.5% from September to October, up 17.7% year-over-year versus 19.3% in September.
According to the Index, single-family home values for the bottom third of the market in the San Francisco MSA are back to July 2003 levels (37% below an August 2006 peak); the middle third is back above August 2004 levels (18% below a May 2006 peak); and the top third remains just above April 2005 levels and 6% below its August 2007 peak.
Condo values in the San Francisco MSA were unchanged from September to October but are up 26.1% year-over-year and to within 4.6% of their December 2005 peak.

Our standard SocketSite S&P/Case-Shiller footnote: The S&P/Case-Shiller home price indices include San Francisco, San Mateo, Marin, Contra Costa, and Alameda in the “San Francisco” index (i.e., greater MSA) and are imperfect in factoring out changes in property values due to improvements versus appreciation (although they try their best).
∙ Home Prices Stage Advance According to the S&P/Case-Shiller Index [Standard & Poor’s]
∙ San Francisco House And Condo Values Tick Up But Slow Their Roll [SocketSite]
Still would much rather be a seller than a buyer (I am neither right now), but clearly the frenzy if last spring/summer eased in the fall. Likely a combination of higher interest rates, which raised real buying costs considerably, and the big bounce off the bottom which simple economics says had to end or at least slow down a lot. 2014 will not see price gains that are anything like those seen in 2013. This is a good thing as big housing price swings in either direction are destabilizing.
Only the top third reflects SF price wise, and .5% month over month is pretty much nothing. Compared with 17.7% year over year, it hopefully indicates plateauing. That would be beneficial to buyers and sellers alike.
Prices have risen through December – two condos (2143 Jackson and 2259 Clay) just sold in Pac heights for around $3 million which is over $1k a sqft and at a price point typically reserved for single families. Condos are going up as sfh inventory remains extremely low so buyers are settling for large 2500 sqft+ as an consolation prize.
These used to sell at a substantial discount versus SFH on a $/sqft basis, not anymore.
How about this one – $2 million for 1650 sqft sfh in Noe, again new highs on a $/sqft basis…
[Editor’s Note: We’re all for using data points to tell a story, but without context they tend to fall flat. The 1,222 square foot home at 471 Hoffman sold for $1,510,000 in 2012. That’s $1,236 a square foot versus the $1,212 per square foot in your example above. So you see, prices for single-family homes in Noe Valley have actually fallen 2 percent over the past year!]