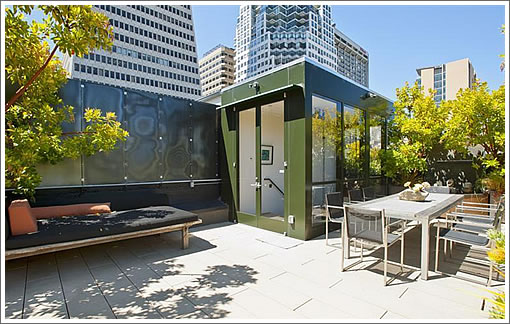
Speaking of million-dollar-plus property sales, the sale of 42 Hotaling closed escrow this week with a reported contract price of $3,500,000, roughly $1,095 per square foot, eight (8) percent under its November 2009 sale at $1,189 per foot ($3,800,000).
∙ Hotaling Isn’t For Horses Anymore: The Penthouse Atop The Stables [SocketSite]
∙ Bay Area Tops The Zip List For Million Dollar Home Sales In California [SocketSite]

oh, well, so much for that talk about the 2009 “bottom.” Down 15% since then with inflation. Down 20% with selling costs. But hey, that’s only about $700,000 in real losses in just three years.
Or, one could just say “$1095/sf and that’s supposed to make me believe the market is bad. Heh, heh. Shows you bears don’t know nuthin.”
It only took 1 post to turn a 300k decrease in value to a 700k loss. Nice work! Any condo selling for over 1k/psf in the city is impressive.
eddy, please explain. Is inflation irrelevant? Are selling costs not real? It was a 700k real loss for the 2009 buyers. What is your point?
“so much for ..,” (based off one property)+ asinine scare quotes = yawn troll
There are always sales that buck trends. No need to get snidely expansive. Everyone knows you’ve seen the charts, studies and graphs that show 09 was bottom, because everybody else on here has seen them. Here, fake. So do the site you seem to so enjoy a favor and refrain from making a snide grandstand every 10th time, or something .
300K nominal loss + 5% of 3.5M = 475K “real” loss.
Inflation does add an extra 200K or so of churning cost, agreed.
Then again, buying and selling within a 5 year period is often a bad idea.
With all that being said; this is one nice place.
gotcha. 2009 was the bottom but this place just sold for several hundred thousand less than its 2009 price. And that was with interest rates that are far lower today, propping up prices. So I guess we’ll just call 2012 the “rock bottom” and you can still pretend 2009 was the “bottom.”
Hey, at least these 2009 buyers didn’t buy in 2006 or 2007. So it coulda been a lot worse.
I’m confused, since when did one house become the market? Are do we now need to calculate and designate a “bottom” for every single property?
It would seem to me that it makes more sense when trying to determine when a ‘bottom’ occurred that we use some type of statistical examination of more then one house. And when that is done it will mean that any one property, even several properties will diverage from the average indicated by the data set.
So it seems to me the value of pointing to one house and saying, “now this must be rock bottom because its down from what some people is saying was the bottom” has as much merit as in 2010 someone pointing to one property that for some reason sold for more then in 2006 and saying “see this place sold for more so there must not have been any downturn in the market since 2006.”
Lovely property, but they needed to put a hot tub on the roof deck!
anon,
I was the one saying EARLY ’09 was bottom (not late). Don’t know if anyone was saying late ’09. The editor thinks it was a totally different year.
and I am sure you know the apple is to compare equals so it’s: Current price paid buy new buy VS. Price paid by previous buyer. Cost of the sale is irrelevant.
and it was newer and nicer I am sure last sale as well so it isn’t a true apple, but that horse has been beat already as well.
[Editor’s Note: Depending upon the segment and area, such as homes in Noe or condos in Soma, it’s actually the data that thinks it’s an entirely different year.]
45 Lake. 2010 – 2012 Apple. +360k. Good thing they didn’t buy in 2009!
eddy, that’s correct. Prices fell quite a bit between 2009 and 2010.
No need to get into on this thread. Let’s just wait for the official thread on this apple.