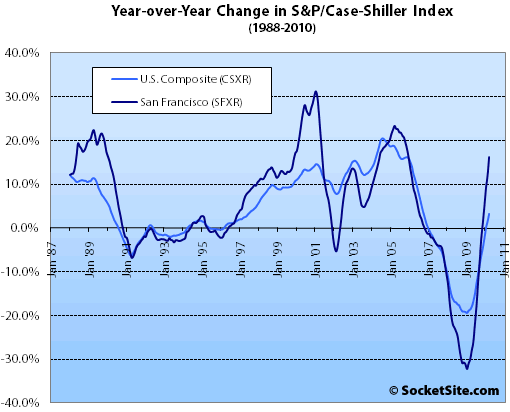
According to the March 2010 S&P/Case-Shiller Home Price Index, single-family home prices in the San Francisco MSA rose 1.5% from February ’10 to March ’10, down 37.4% from a peak in May 2006 but up 16.1% year-over-year.
For the broader 10-City composite (CSXR), home values fell 0.4% from February to March (the fifth consecutive slide) and remain down 30.9% from a peak in June 2006 (up 3.2% year-over-year).
Looking at the monthly statistics, 13 of the 20 metro areas showed a decline in March compared to February. Boston was flat. Eight MSAs posted new index lows in March – Atlanta, Charlotte, Chicago, Detroit, Las Vegas, New York, Portland and Tampa. Las Vegas and Phoenix have peak-to-current declines of 56.3 and 51.8%, respectively.
On a more optimistic note, Los Angeles, Minneapolis, San Diego and San Francisco have shown recovery from recent lows of +7.2%, +7.4%, +10.9%, and +16.2%, respectively. San Diego, in particular, has stood out with 11 consecutive months of increasing home prices.
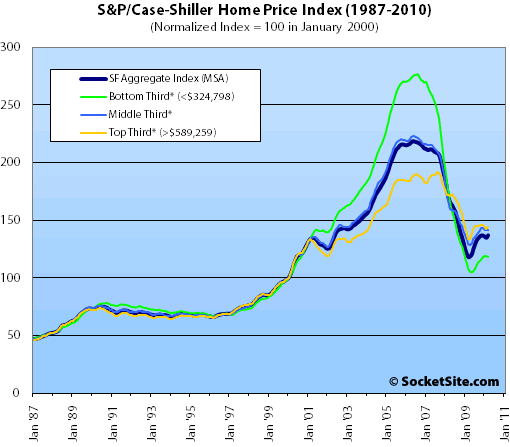
On a month-over-month basis prices fell nominally across the bottom two price tiers but rose for top tier single-family homes in the San Francisco MSA.

The bottom third (under $324,798 at the time of acquisition) fell 0.1% from February to March (up 10.3% YOY); the middle third fell 0.2% from February to March (up 8.9% YOY); and the top third (over $589,259 at the time of acquisition) gained 1.6% from February to March (up 8.2% YOY).
According to the Index, single-family home values for the bottom third of the market in the San Francisco MSA are just below September 2000 levels having fallen 57% from a peak in August 2006, the middle third is hovering around May 2002 levels having fallen 37% from a peak in May 2006, and the top third is back to February 2004 levels having fallen 25% from a peak in August 2007.
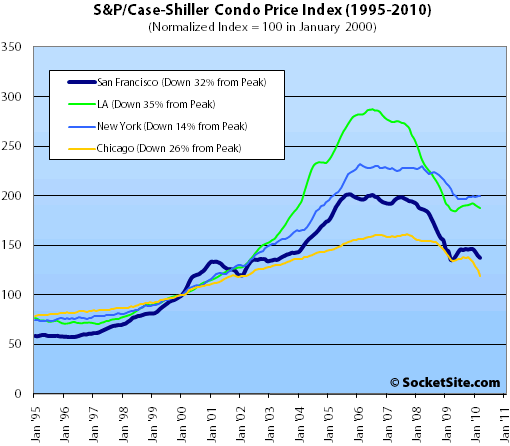
Condo values in the San Francisco MSA fell 1.7% from February ’10 to March ’10, up 1.5% on a year-over-year basis and down 31.7% from an December 2005 high.

Our standard SocketSite S&P/Case-Shiller footnote: The S&P/Case-Shiller home price indices include San Francisco, San Mateo, Marin, Contra Costa, and Alameda in the “San Francisco” index (i.e., greater MSA) and are imperfect in factoring out changes in property values due to improvements versus appreciation (although they try their best).
∙ First Quarter of 2010 Indicates Some Weakening in Home Prices [Standard & Poor’s]
∙ February Case-Shiller Index: San Francisco Falls Across All Price Tiers [SocketSite]
Its a little crazy, to me, that the steepness of the YOY% recovery is actually, for now, steeper than the decline.
anyway, good to see the top tier continuing to do so well.
You never took Calculus, did you?
More than 95% of all mortgages are currently being originated by the Government. They don’t give a damn about the actual value of the collateral, but private players using real money are not fooled…
Anyways, it’s pretty clear the market is stabilized. The yearly rate is high but that’s mostly a statistical result of the 1-Y moving range. Things are stabilized as it seems. Now that the stock market is going south, I wonder what the effect will be when it mixes with the end of the spring bounce. 2 big unknowns: 1 – is how much shadow inventory will come back online. 2 – foreclosures are still going strong. Everything points to a pause in the bounce between now and End of Year.
[Editor’s Note: Fannie Follows Freddie And Takes Another Quarter In The Shorts]
I did, yeah. Kind of a pre-requisite for becoming an actuary.
Still find it surprising though.
I didn’t expect double digit price inflation to return so quickly to the SF MSA.
I doubt many here did, but maybe it’s just me.
I didn’t notice above if these are seasonally adjusted or not. Hopefully the data above is the non-seasonally adjusted data.
Case Shiller came out with a warning a few months ago that the Seasonal Adjustment is not reliable due to various peculiarities with our current RE market.
I should clarify:
clearly only some of the Federal support of housing has stopped (FTHB credit, fed purchases of Treasuries/mortgages).
the majority remains (Subsidized mortgages through Fannie/Freddie, HAMP, altered accounting rules for the banks, etc)
I didn’t notice above if these are seasonally adjusted or not. Hopefully the data above is the non-seasonally adjusted data.
As always, non-seasonally adjusted. We’ve never bought into Case-Shiller’s seasonally adjusted numbers.
Nothing surprising about mortgage rates. Our government, through its myriad of bailout tentacles, is the only mortgage lender out there right now. Economic jitters have pushed investors into treasuries again, slightly lowering the government’s borrowing costs and mortgage rates accordingly. As has been said here many times before, the subsidies come at an alarming cost to the nation, are unsustainable, and our government has no clear exit strategy.
But human beings are naturally short-sighted and generally keen on remaining blissfully ignorant of larger systemic problems. From my anecdotal observations, the mentality among many potential buyers today seems to be one of getting into the market while both prices and mortgage rates are relatively low. Relatively being the operative word – prices in many places, including most of SF, remain above what fundamentals would dictate, while mortgage rates are obviously an artificial construct generally detached from underlying credit risk. So realtors and other pundits are pushing the “great time to buy” mantra. Get in now before the government raises lending standards and rates go up, inflation hits, etc.
But when you ask the same people, “What do you think will happen to home prices when rates go up or lending standards tighten?” you tend to get a vapid gaze in response. Can our government keep the mortgage market nationalized forever? Make home loans a government service, just like education, highway construction and border protection? Maybe. But the tradeoff will likely be higher taxes combined with those austerity programs that are all the rage in Europe right now. Pick your poison.
Over what time period are we believing? Since core inflation is actually falling, and the CS price index is up 16.1% year-over-year, I don’t know how far specifying “Real terms” gets you. Even using the full CPI-U, without seasonal adjustment, only gets you 2.2% over the last twelve months.