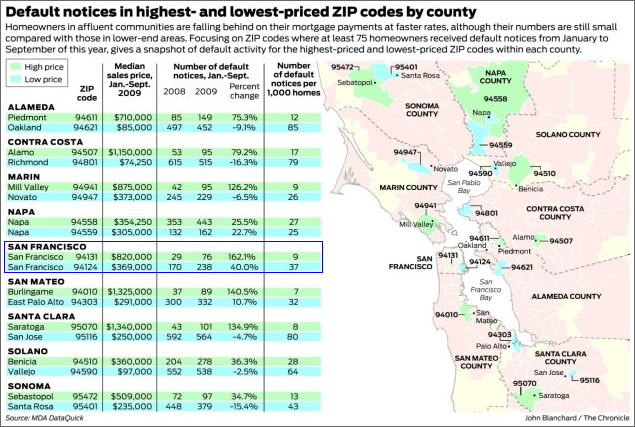
It’s a story on a trend that shouldn’t catch any truly plugged-in readers by surprise: foreclosures are heading upstream. And while the raw numbers remain relatively small as compared to outlying areas and San Francisco’s District 10, it’s the more expensive areas that are leading the way with respect to relative rates of change (i.e., growth) as rates in the less expensive areas are slowing or reversing course.
∙ Default notices rising in upper echelon ZIPs [SFGate]
∙ Actual San Francisco Foreclosures Up 31.6% QOQ (Down 6.8% YOY) [SocketSite]
∙ San Francisco Real Estate Districts: Maps And Neighborhoods [SocketSite]
That’s one hell of a graphic!
Contrast these numbers with the MOBS of people touring the very few probate/foreclosure “deals” out there in San Mateo county (e.g. Belmont Hills, San Carlos etc.) Hundreds of buyers touring those places and all sell over-asking. The demand for foreclosures is absolutely huge and so far has resulted in no meaningful price declines compared to retail-priced homes.
But foreclosures = falling prices is a nice theory (absent the huge demand for them here).
Jimmy, that’s because the foreclosure process is largely stalled here in CA. Wait until the foreclosure moratorium lifts and we should see the supply rise. That is, if the banks actually put them on the market. Right now, they have no incentive to flood the market with foreclosures as they can just live off of cheap Fed and US govt money until they think the market can handle the volume.
Of course, in the past banks used to just dump foreclosed houses on the market. I have the strong suspicion that they have used the moratorium period to pull themselves into a more organized setup for selling houses at market rates. They know that how they sell has an impact on the local markets, and if they own a lot of inventory they must be aware that how they sell will have a big impact on the prices they get for the rest of their inventory. You will notice that more foreclosure and bank owned houses are being reasonably marketed by competent real estate brokers, etc. So, even with a new wave of foreclosures coming on the market, I suspect it will not have the same impact on price that the first wave did (when the banks were not prepared to manage the flood….).
[Editor’s Note: Speaking Of Million Dollar Foreclosures (And “Shadow Inventory”)]
Either way, once they get going, the foreclosures will add to inventory, in contrast to the the pre-foreclosure “I’m-Trapped-In-My-Home-And-I-Can’t Get-Up” crowd, which flooded the market in 2008 but in 2009 has given up and reduced inventory.
“San Francisco,” 94131, i.e. southern Noe Valley, Diamond Heights, northern Glen Park, is only one NOD above the 75 needed to be featured. There’s an 820K median sale price in the area. What percentage of these NODs occurring between January and September 2009 have righted the ship do you suppose? What number is down to job loss? What number due to ARM reset? An interesting statistic would be the number of NODs that occurred in the same area during the teeth of a prolonged recession YoY versus the previous year.
errr, that was, in the LAST recession versus this one, during mid ’90s? To look 94131 stats. I doubt those numbers are available anywhere. And the houses cost 1/2 as much anyway.
the pre-foreclosure “I’m-Trapped-In-My-Home-And-I-Can’t Get-Up” crowd, which flooded the market in 2008 but in 2009 has given up and reduced inventory
tipster, you continue to repeat this theory at every opportunity since the inventory numbers suprised the SS crowd and dropped. I’m willing to believe this convenient rationalization, but do you have *any* evidence? are the LTV ratios of the Noe, Cole Valley, Laurel Heights, … properties pulled from the market really all 95% or higher? seems unlikely to me, but I have an open mind.
tipster refers to the “‘I’m-Trapped-In-My-Home-And-I-Can’t Get-Up’ crowd.” I’m not entirely sure that all of the people in this category are necessarily pre-foreclosure. Some of them seem to want to sell (and may even rent out the property in the meantime), but want a better price than the market suggests now (e.g. I know a few boomers who want to sell their rental properties, but don’t want to do it in a down market). Hell, some of them even have 0% LTV, but almost all the people I’m thinking of easily have less than 50% LTV.
So I do think tipster is right that there is a decent amount of “shadow” inventory, but the name tipster gives to the group seems more inclusive than just pre-foreclosure, even if that might be accidental.
Interestingly enough, Piggington published data similar to what anonn is talking about with respect to San Diego, so the data must be available somewhere. For reference, here are the charts for San Diego, and I have no idea how this compares to SF:
http://piggington.com/home_sales_per_trustee_sale
sfrenegade, if the balance on my loan + 6% for commissions and closing costs is less than the current market value, I am *not* trapped.
I may want to sell, I’m likely am hoping for a better (maybe unrealistic price), I may by trying to recover more of my down or paper profits that I didn’t lock in back in 06, I might be short-sighted, greedy and foolish, but I am certainly not trapped in any way. I can walk at any time with my credit score the better for it.
Depends on your definition of trapped. They’re not trapped in the “walk away” sense by any means. They may have cashflow or paper profits or something else desirable, but may have been depending on a particular valuation re: retirement or paying off their current home loan (as are the cases I’m thinking about), rendering them more lightly trapped. Sometimes that current home loan was due to a bubble purchase because they wanted their dream house, but not always.
Obviously, this is just anecdotal, but I do think there are more people who want to sell than the current inventory counts show.
Sigh. So many discussions on this site boil down to our lack of data at the depth and detail we need to make more informed conclusions. Statistics aggregated by neighborhood such as average LTV, loans of each type (30yr, 15yr, 5/1, 10/1, option, prime/subprime/alt-a, etc) would be extremely helpful.
Why is it so hard to get this kind of data anyway? Anything that’s a matter of public record should be searchable, indexable, and plottable. Please everyone do what they can to support information that’s more free. There’s no reason someone should have to be in the industry or pay lots of $$$ to discover it – having a more efficient, more informed market will be better for all of us.
sfrenegade, ok, but by your definition there are many more who are “trapped” in their rentals, because there exists *some* price (currently more than they are willing to pay) at which they would want to buy. see how meaningless your characterization becomes?
tipsters definition has been pretty specific. it was explicitly “pre-foreclosure” here, and has been used repeatedly as part of the “low inventory is bad news” theory. the concept is that prices have dropped into short sale territory for the majority of sellers, causing them to pull from the market and either pay off underwater loans or advance down the path toward foreclosure. this happens, but I have yet to see evidence that this is what is going on here.
annoyed, completely agree!
Sure steve, I don’t disagree. I don’t think it’s an easy-to-characterize scenario at all. I also think we’d need a better handle on NOD/NOTS numbers for tipster’s definition.
and agree with annoyed on the data issues as well. It should be easier to find than it is.
and has been used repeatedly as part of the “low inventory is bad news” theory.
Now that is some real straw man rhetoric. No one has made the argument that low inventory is bad news.
J, you are mistaken. you should read tipster on this subject where she/he explains that low inventory is the “predictable” 2nd stage of the complete RE meltdown. first, the smart folks sell at any price, so there is price pressure. then the dumb folks, sticking to their wishing prices, get discouraged and pull their listings. some property changes hands as knife catchers trickle in. finally, the foreclosure tsunami washes over everyone, causing at 40%++ decline in prime prices.
might I be simplifyng? possible, but I don’t believe I have invented any strawmen.
No where in that scenario, is low inventory the bad news. The hypothetical large supply of foreclosures would be the bad news.
Currently, sales volume is low(moving average), listed inventory is at a normal level for this time of year(not including all the foreclosures) – https://socketsite.com/archives/2009/10/san_francisco_recorded_sales_activity_in_september_up_1.html
J, you are mistaken. you should read tipster on this subject where she/he explains that low inventory is the “predictable” 2nd stage of the complete RE meltdown
so how come no one predicted it back in say, Spring, or summer..except for ORH of course…
its easy to say after an event. “that was predictable”…
you are mistaken. you should read tipster on this subject where she/he explains that low inventory is the “predictable” 2nd stage of the complete RE meltdown
I am not mistaken. I understand the difference between a symptom and a cause…
REpornaddict, exactly. too bad J doesn’t spend his energy challenging statements like the original one for which I asked for any proof:
the pre-foreclosure “I’m-Trapped-In-My-Home-And-I-Can’t Get-Up” crowd, which flooded the market in 2008 but in 2009 has given up and reduced inventory.
so how come no one predicted it back in say, Spring, or summer..except for ORH of course…
its easy to say after an event. “that was predictable”…
I wish I had predicted this in the spring, like April. I’ve said it before then too, but here is a typical post from more than 6 months ago.
The SF market basically had to wait until enough people were trapped in their homes in order for prices to stop falling. We now have that equilibrium, which exists only because no one has been foreclosing in any real numbers for 6 months.
That will soon start to change, and as it does, the numbers of people getting trapped in their homes will rise, until they too finally hit the foreclosure process. At that point, I think the demise of SF real estate prices is pretty much baked in.
That map of misery tells us this problem is mostly limited to California. The US isn’t going to bail just us out when the rest of it has already suffered, and the state is bankrupt.
So I don’t see anything good on the horizon: we’re just in an eye of the storm because nearly everyone who bought or refinanced from 2004-2008 is trapped, and about 1/6 of them are probably already resigned to foreclosure in the next two years.
The others didn’t take out such a toxic loan or have already refinanced it or can refinance it or afford it when it recasts or weren’t making the minimum payment in the first place and aren’t in trouble. But some of them are literally trapped: they aren’t going to be foreclosed, but they can’t move even though they might need to for a job or personal situation.
Posted by: tipster at April 25, 2009 1:14 PM
I don;t see any reference there at all to future falls in inventory levels to be honest tipster..If refers more to movements in prices.
Also I think
nearly everyone who bought or refinanced from 2004-2008 is trapped
says to me, you have a really,really loose definition of trapped.
Basically if someones home is worth less than what they payed for it, you call them ‘trapped’.
Just because a home is worth less than what people payed for it doesn’t mean they are trapped in that asset imo.
In the same way everyone is trapped in their equity holdings too, although I appreciate this doesn’t quite have the same impact as housing e.g. lack of geographical mobility.