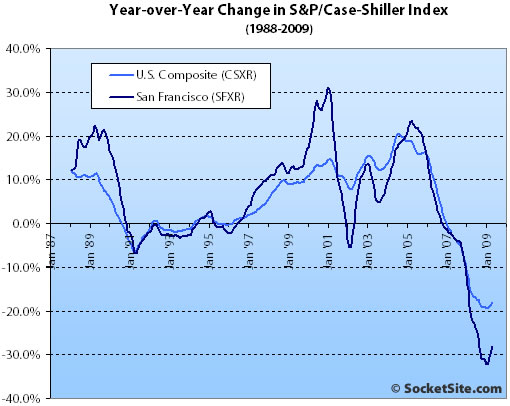
According to the April 2009 S&P/Case-Shiller Home Price Index (pdf), single-family home prices in the San Francisco MSA gained 0.6% from March ’09 to April ’09, down 28.0% year-over-year and down 45.8% from a peak in May 2006.
For the broader 10-City composite (CSXR), home values fell 0.7% from March to April and are down 33.6% from a peak in June 2006 (down 18.0% year-over-year).
In addition to the 10-City and 20-City Composites, 13 of the 20 metro areas also saw improvement in their annual return compared to that of March. Furthermore, every metro area, except for Charlotte, recorded an improvement in monthly returns over March. While one month’s data cannot determine if a turnaround has begun; it seems that some stabilization may be appearing in some of the regions. We are entering the seasonally strong period in the housing market, so it will take some time to determine if a recovery is really here.
San Francisco MSA single-family home prices continued to fall across the bottom two-thirds in terms of price tiers, but gained nominally at the top.
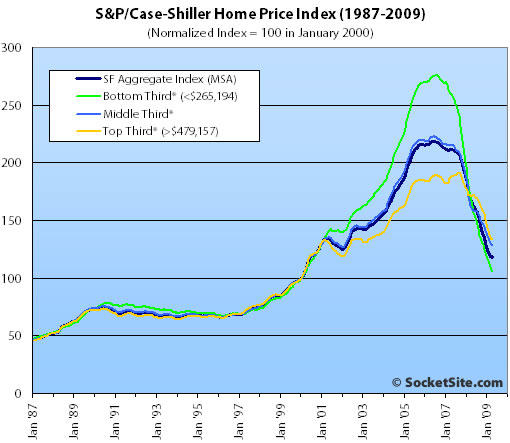
The bottom third (under $265,194 at the time of acquisition) fell 1.8% from March to April (down 35.4% YOY); the middle third fell 0.7% from March to April (down 19.5% YOY); and the top third (over $479,157 at the time of acquisition) gained 0.2% from March to April (down 21.9% YOY).
According to the Index, single-family home values for the bottom third of the market in the San Francisco MSA have retreated below April 2000 levels having fallen 62% from a peak in August 2006, the middle third has fallen to November 2001 levels having fallen 42% from a peak in May 2006, and the top third is holding at April 2003 levels having fallen 30% from a peak in August 2007.
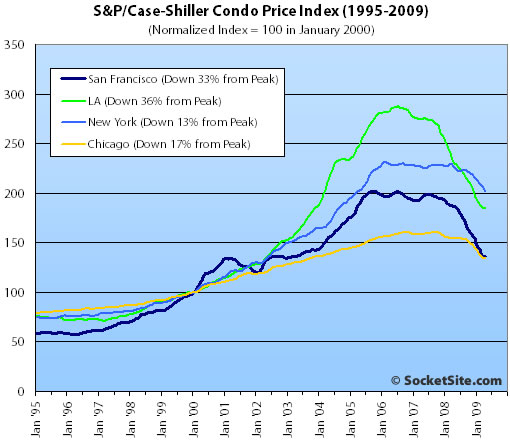
Condo values in the San Francisco MSA gained 0.3% from March ’09 to April ’09, down 26.9% on a year-over-year basis and down 32.5% from an October 2005 high.
The standard SocketSite S&P/Case-Shiller footnote: The S&P/Case-Shiller home price indices include San Francisco, San Mateo, Marin, Contra Costa, and Alameda in the “San Francisco” index (i.e., greater MSA) and are imperfect in factoring out changes in property values due to improvements versus appreciation (although they try their best).
∙ The Pace of Home Price Declines Moderate in April According to S&P/Case-Shiller [S&P]
∙ March S&P/Case-Shiller: San Francisco Slide Slows But Continues Fall [SocketSite]
This also happened in April of 2007. Prices saw an uptick from 211.09 to 211.47. However, it is an encouraging sign.
(*Note – the index aggregates disparate neighborhoods so it may not accuractely indicate what is happening in your area)
Its interesting that the rate of change of the index is starting to turn upwards, as it must eventually do once the year-over-year price declines taper off. But look at the depth of the drop compared to ’91 — there is really no comparison: this time is about 5x worse (-33% vs. ~ -6%).
I also note that the SF MSA mirrors the country as a whole (but with about 2x volatility).
Where’s the decoupling we hear so much about?
Bottom third comes close to 2000 levels.
Top third comes close to 2003 levels, even bubble-icious 2001.
Now we’re getting somewhere at last…
The decrease takes a small breather. Is this the turnaround so many are waiting for? Expect analysts to call it the bottom for the 15th time.
And I noted with amusement ester’s comment from an earlier thread:
those who buy at today’s price levels would look very smart in 5 years.
How so? Prices are still dropping at >30% year-over-year. Smart people (that is, those who value their downpayment) will wait until prices level off then “jump in.” Classic newbie mistakes: buying too high & selling too soon.
So please answer this for those of us who are clearly not as astute as you are: Oil is today at >$70 in the depths of a massive global recession. Cheap oil drives economic growth and globalization.
What do you suppose is going to happen to our economic recovery in a scenario of triple-digit oil prices? $147/bbl oil already drove us into a near-economic collapse. What do you suppose will happen when, in the middle of said collapse, oil is again over $100 a barrel (it’ll happen by 2010 if not sooner).
My prediction, for the record, is that any scenario in which oil prices are over $100/bbl for an extended period will be extremely negative for net oil-importing countries.
“What do you suppose is going to happen to our economic recovery in a scenario of triple-digit oil prices?”
Lemme put on my bull horns to answer that one : Everyone will be clamoring to move to a dense urban center to save the fuel costs associated with suburban commuting. The price of SF RE will skyrocket !
Well there’s a little truth in that statement. Higher fuel prices will make urban cores more attractive. But that won’t offset the negative effects on the global economy. So SFRE won’t be affected nearly as bad as the exurbs.
$147 oil did not cause the ‘near-economic collapse’. The ending of a 30 year long credit expansion (eventually a credit bubble) is what drove us into a near-economic collapse.
One helped trigger the other.
Everything interconnects.
i may be naive here but shouldn’t strong economic growth be the trigger higher oil prices? how are oil prices going to increase without the strong economy accompanying it? of course it could be a supply issue like political instability in the mid-east or whatever, but that’s always been the case as far as i know.
So if you go back to very first principles, you could make the argument that our increased standard of living (and our increased ability to consume) is a direct result of our increased ability to consume energy.
After all, you can create credit out of thin air using leverage but you cannot create energy out of thin air.
So if the price of that energy (which directly impacts the cost of supporting our current standard of living) rises by 1500% as it did between 1996 and 2007 (oil going from roughly $10/bbl to $150/bbl), you’re telling me, seriously, that that was just a secondary effect and the REAL, true, fundamental root of the problem was that we couldn’t create any more money out of thin air?
Or is it somehow possible that we are stretching the current technological limits of our ability to recover oil and that is causing price increases despite a near economic collapse? (And as an aside, the quality of said oil is going way down — we now rely on oil sands, heavy oil (high in asphaltenes, waxes etc.) and deepwater fields for new capacity to replace the old easy-to-get stuff?)
Because, really, I find the question quite interesting and quite fundamental: if the problem really isn’t credit but energy then we are in for a whole huge world of hurt going forward.
Oil can be expensive without having economic expansion. Think 70s. Country at war, economy in recession, high Oil prices. The parallel stops there though, as inflation is out of the picture today. A big cushion against inflation is the very high margins coming from importing from low cost countries. Plus demand decreases as vaporizing equity is removing the IOUs we used to consume us out of the 2001 recession.
Though oil prices are economically meaningful, can we keep this chain dedicated to the price uptick in C-S?
Seems to me that this is a legitimate sign that the freefall is over and that we are at or near the bottom.
I’m predicting another year of plateauing prices. They won’t go up or down more than 3-5% from where we are now. That’s my guess.
Sorry, I missed the price uptick. Can you point to it on one of these charts? Are we talking year-over-year or month-to-month? Because year-over-year we’re still down over 30%.
Just because things are related doesn’t mean one causes the other. High priced oil did not cause the credit bubble to burst. ~$150 oil was partly a result of the same credit bubble that led to $700k teardowns in bayview. Hedge funds were borrowing money and speculating on oil which helped drive up the price.
Right now oil is trending higher again partly because of speculation, it is being used as an inflation hedge against a devalued dollar. The price of oil is moving more by speculation, financial industry trading then it is by pure supply/demand.
Rillon: so if I can summarize your statement, credit drives the economy, not energy.
As someone with a physics background, I find that quite interesting.
Sorry, I missed the price uptick. Can you point to it on one of these charts? Are we talking year-over-year or month-to-month? Because year-over-year we’re still down over 30%.
there is no price uptick. people might be referring to the uptick in the year over year rate of change (the first chart). this is acceleration, not price (as is the second chart).
Sorry, but oil is sometimes used to soak up extra cash that no one sees any other way to invest. Oil prices did not cause the collapse: people saw the collapse, pulled their money out and parked it in oil.
Now we have a bunch of government money being used for the same purpose. It certainly doesn’t help to have high oil prices, and it definitely slows any recovery (not that we’re even close to one) but that wasn’t the cause of the bust.
As for CS flattening, I suspect we’ll hold for awhile. The effect of foreclosure moratoriums and the like is certainly real, though temporary. And stuff looks cheap to those people who have looked in the past few years. Many probably feel it isn’t going to get a whole lot worse relative to the estimated time they are planning on spending there.
But business activity sucks, hiring is terrible, and new businesses are not forming as fast as old ones are disappearing, so I don’t see any reason for a turnaround. I suspect things will drift up and down until December, well within any margin of error. The catastrophe appears to be over, at least for now, and so people are looking for bargains and buying. Then if Christmas is bad (which I think it will be), then you’ll see prices start to tumble again. Pets.com stock wasn’t a straight shot down either, but fall it did.
Seems to me that this is a legitimate sign that the freefall is over and that we are at or near the bottom.
2 counterpoints:
1) RE in the SF MSA is still falling at 28% year over year. I hardly call that as “the freefall is over”. imagine how “happy” you would have been in 2006 if your house “only” fell 28% in a year! it’s only after several (-)30%+ yoy months that (-)28% seems like a “bottom”
sure, we do have a change of the second derivative, but we still have significant ongoing RE losses
unless you only mean that the freefall is over, but we still have significant forward facing losses that just don’t happen to be in freefall?
2) the bottom only designates when RE prices stop falling. it says nothing about recovery. recovery can take 5-10+ years after housing bottoms.
there is absolutely no reason to hurry into housing. I would wait until we see 12 consecutive months of Y-O-Y gains and then jump in. it’s not like RE is suddenly going to rocket up! (unless we have massive inflation that is acccompanied by wage increases, the so called “wage price spiral”, which is unlikley anytime soon IMO).
on a side note:
it would not be surprising to see the depreciation in RE to slow down rather quickly (in percentage terms)
You can only have 30%/year losses for so long…
So if the price of that energy (which directly impacts the cost of supporting our current standard of living) rises by 1500% as it did between 1996 and 2007 (oil going from roughly $10/bbl to $150/bbl), you’re telling me, seriously, that that was just a secondary effect and the REAL, true, fundamental root of the problem was that we couldn’t create any more money out of thin air?
You might want to look in to the Commodities Futures Trading Commission’s tactics around 1991 where they took the lid off of about 60 years of anti-speculator regulations to let Goldman Sachs run hogwild in oil derivatives before you go blaming everything on supply/demand. The run-up last summer was pure fictional make-believe. Demand was falling, supply was expanding and prices were exploding on speculation of a dollar collapse. Instead, the global credit market collapsed and everyone quickly remembered that the $ is the global reserve and oil quickly retreated to $30.
Can you buy California RE using California IOU’s? can you pay your mortgage with California IOU’s? that is the other big elephant in the room. I guess we’ll find out tomorrow, huh?
I still think that California will get the begged-for bailout at some point in time. But I also think there will be a pound of flesh taken as well. California is a bankrupt state. It must lower services or increase taxes at some point. There is no alternative. The Federal govt is not going to just hand over money year after year.
I’d anticipate increases in taxes. specifically income and sales and property taxes. California is simply too far in the hole to solve its problems solely with cuts in services. (too many entitlements etc).
increased taxes are likely to drag on any future home price appreciation. (and hence the relevance to this thread).
How come prices gained, overall, 0.6% – yet each ofthe 3 tiers did worse than this (-1.8, -.7, +.2)?
I thought this index was free of mix factors etc etc..
Just woke up, so brain not in gear – may be a simple answer but am confused..
LOL – I closed escrow on my SF condo Dec of 06. Boy do I feel stoopid. That’s right when the line crossed to negative on the chart.
unless we have massive inflation that is acccompanied by wage increases, the so called “wage price spiral”, which is unlikley anytime soon IMO
We’ve been disagreeing for awhile on whether or not there would be a POOM anytime soon. Have you decided that, although we may have just gone through a KA, the POOM is a long ways away, if it ever arrives?
Have you decided that, although we may have just gone through a KA, the POOM is a long ways away, if it ever arrives?
tipster: I’m a horrible market timer so rarely try, especially with POOM which relies too much on politics IMO.
My initial thought would be that POOM would happen maybe 2-3 years after Ka. However, I’ve never been wed strongly to that viewpoint… instead I’ve just decided I would watch for the signs and act accordingly.
I feel that we need one of 3 things to happen for POOM:
either
-foreigners have to stop buying our debt (which would force our Fed to monetize our debt)
OR
-protectionist measures must be enacted
OR
-banks need to start lending “normally” again to increase the velocity of money. but they’re so far in the hole this seems a long way off.
thus far none of the three has happened to a significant extent (although the Fed IS buying long term Treasuries…)
one thing I did NOT foresee was the absolute willingness of the US Govt to completley zombify its banking system. I didn’t think they’d be that crazy/foolish. I’ve foreseen a lot, but nobody is perfect, and that one got me. I thought they would at least have let 1-2 of the big boys fail. (I’m speaking specifically of Citi).
That said; I still disagree with other posters who feel that the Fed/govt can pump all this money and then simply take it away when signs of inflation come. As soon as they try, the market will cry and have a tantrum and the Fed has shown it is but a pawn for the financial elite and the red headed stepchild of Treasury… the Fed has trapped itself. GREEN SHOOTS!
silly question … is Case-Shiller inflation adjusted?
are those nominal prices or real prices? .. thanks!
Trendyloin: Need not feel foolish. Myself and plenty of my friends that were so pleased we did not get suckered into the real estate bubble of ’05-’07 only to end up losing a lot more of our funds in the stock market. At least you still have a home to show for it…
Are these seasonally adjusted numbers?
Shiller thinks the prices will level off (http://www.bloomberg.com/apps/news?pid=20601087&sid=aIbMtWW6cVO4). If that’s the case, then I I’ll keep renting for a while longer. Why pay $1.2m when you can rent it for $4000/mo?
Wow. so Shiller sees bottom. Case is ‘taken aback’.
anyone know how the trading indices look now post these results and the comments above?
btw still remain confused re the question I made above..
“How come prices gained, overall, 0.6% – yet each ofthe 3 tiers did worse than this (-1.8, -.7, +.2)?”
btw Fishtarian, one reason to buy if prices are going to stay level is rates, they are historically low now and may not remain so.
actually, i bought this month… and i’m glad i bought. =) i’ve never bought before, so perhaps i am one of those foolish “first time homebuyers” that are derided on this board… but time will tell. i thought i’d lock my money in a house in case of run-away inflation.. and with my low interest rate.. i’m all set. borrowed money to buy a property at today’s price and today’s interest rate… which will only be a plus if we have inflation.
regardless, even without run-away inflation or a depression in the market, my property is a better place than my current rental… and still almost the same cost per month after tax. i’m quite happy.
btw, all of you talking about oil prices, remember the $145 per barrel was almost exclusively a result of speculation (not underlying fundamentals). so i’m not sure when we’ll see $145 again… i think it is a bit of a stretch to think it’ll happen in 12 months. maybe in 24 months, but 12 months….?
The strength and weakness of the Dollar has significant bearing on Oil prices since oil is priced in dollars.
totally agree with the dollar point… i just don’t know if inflation will be $145 per barrel type of inflation. magnitude still unknown.
Jimmy – Energy certainly effects the economy but I was mainly taking exception with your comment that it was the price of oil that led to the near economic collapse. I believe it was the bursting of the credit bubble that led to the near financial collapse last year. The dramatic rise and fall of oil last year were symptoms of the problem, not the cause. The rise and fall of housing prices shown in the graphs above are also the result of the credit bubble and its bursting.
The recent rise in oil is a reaction to all the measures being taken to try to ‘unfreeze’ the credit market (which froze because of all the deleveraging that is taking place, which again is reflected by the falling housing prices).
“btw Fishtarian, one reason to buy if prices are going to stay level is rates, they are historically low now and may not remain so.”
Then you can rent till the history corrects itself. Without the prospect for appreciation, this need to lease for 30 years at a huge premium is just irrational. If anything, you should get a discount for signing such a long lease. I’d rather own one year at a time and have someone else subsidize my life style.
Rillion — I think you may be underestimating the ‘drag’ that high energy prices impose on the global economy.
How the prices got to be high can be a subject of debate … but the effect of high prices is to rein in economic growth and transfer money from oil importers to oil producers (some of whom kindly loan it back to us and others who don’t).
It is a major drag on the entire economy, and actually, on the entire concept of global manufacturing (i.e. moving manufacturing capacity to a location with cheap labor because you can ignore the cost of bunker fuel to ship parts back and forth).
I would say that fundamentally, energy does much more than “effect” the economy. Without it, we have no economy & people ignore that at their peril.
I think you will be waiting for ever if you wait for the cost of renting and owning to be equivalent in San Francisco.
But it sounds like you will be happy with that if there remains a cost differential, so fair enough.
“btw Fishtarian, one reason to buy if prices are going to stay level is rates, they are historically low now and may not remain so.”
That’s not right. If rates go up, then prices will go down. The low rates right now are propping prices up.
If you look at non-seasonally adjusted numbers, SF prices went up 0.6% in April like SocketSite said. If you look at seasonally adjusted, SF prices went down 0.5% in April.
The seasonally adjusted numbers also say this:
low tier (under $268,427) down 2.2%
mid tier down 1.6%
high tier (over $486,735) down 1.2%
I don’t understand why most of the posts across media on Case-Shiller are based on non-seasonally adjusted numbers. Home buying definitely has an up-trend over the summer.
“btw Fishtarian, one reason to buy if prices are going to stay level is rates, they are historically low now and may not remain so.”
Then you can rent till the history corrects itself.
I misread pornaddict. I thought he said the price may not remain low. My mistake, I’ll concur with corn instead.
I don’t understand why most of the posts across media on Case-Shiller are based on non-seasonally adjusted numbers. Home buying definitely has an up-trend over the summer.
Spin. anybody who knows anything about Real Estate knows that there is major seasonality effect. Thus, when they harp on the Non seasonal adjusted numbers they are either ignorant of RE macroeconomics or they are trying to spin one way or another.
Jimmy – take another look at the charts at the top of the thread and explain to me how oil peaking at around ~150 a barrel in the summer of 2008 was drag on housing prices which started to fall in 2005-2007? That’s what I’m getting at, this economic collapse started well before oil peaked.
“So if the price of that energy (which directly impacts the cost of supporting our current standard of living) rises by 1500% as it did between 1996 and 2007 (oil going from roughly $10/bbl to $150/bbl), you’re telling me, seriously, that that was just a secondary effect and the REAL, true, fundamental root of the problem was that we couldn’t create any more money out of thin air?”
Jimmy, where are you getting your data from? Oil did not fully spike until the summer of 2008. At that point housing, which had become the backbone of the credit bubble through MBS’s, had already been declining for 2-3 years. Based on the following:
http://tonto.eia.doe.gov/dnav/pet/hist/wtotworldw.htm
The highest price for oil in the US during 2007 was $90. And that was at the tail end of 2007 (November).
I just don’t see the evidence that the price of oil was a major factor in the cause of the current global economic recession. Did it contribute, sure somewhat, but I think the collapse of the housing market with proceeded the peak of the oil bubble by 2+ years was a much bigger factor.
How come prices gained, overall, 0.6% – yet each of the 3 tiers did worse than this (-1.8, -.7, +.2)?
I’m with you on this one. I downloaded the Excel sheet for the tiered numbers and this just doesn’t make any sense. Anyone want to call S&P on this one (or explain it to the math impaired)?
Glad it’s not just me..and the seasonally adjusted show a similar result – with the overall result better than each of the tiers…
anon, congrats on the new purchase. Like I said a few times now, you surely will look very smart in 5 years.
Be sure to post back in 5 years.
Rillion: Here’s the disconnect that I see philosophically — real estate does not drive the economy. Its a consumption item. We all need to consume shelter at some level (just like we need food, water and oxygen) but it doesn’t “drive” the economy. After you build a house, it just sits there and provides shelter (and needs repairing). That’s it. Building houses is productivity, but living in them isn’t.
Contrast that to building a factory or running a farm, or developing a new oilfield, each of which produces an output year after year. That’s productivity. Banks (in theory) are meant to provide capital to finance the construction of new productive assets. But banking in and of itself is not “productivity.” What do bankers actually make? Paper. Debt. Nothing. Take your pick.
That’s why I have a hard time connecting real estate valuations to economic collapse. I think the root of the economic problem is very, very different. In fact I doubt we even agree on the definition of the problem — in my eyes the problem is unemployment or underemployment and declining real wages. That’s solved by increased production, not increased real estate prices.
The economy can and hopefully will chug along quite happily whether real estate values are high or low as long as we as a nation are being productive in the sense of producing goods or providing services that are valuable to humanity.
So where does oil come into the picture? It’s the fundamental input (i.e. energy) into every single productive activity in our economy. Raising the price by an order of magnitude is a huge, huge change in the price of a fundamental input to the economy (while the value of the outputs scarcely changed at all or even declined).
I’m sure someone well versed in economics could write an entire Ph.D dissertation trying to prove it with numbers, but I won’t bother here.
Jimmy – Over the last thirty years the economy in my opinion grew more then it should have based on increased production, real wages, and productivity. How did it manage to do this? Through the creation of credit. Consumers made up for stagnant wages by borrowing. As credit became cheaper and more readily available, it caused more and more money to start flowing through the economy looking for a home. We didn’t see much price inflation because companies shifted production to lower their costs. So ultimately a lot of this easy credit money ended up looking for a place to call home, and it found it, first in the stock market bubble, then when that burst it found it way into the real estate bubble.
As housing prices escalated, it allowed consumers to borrow more and more money against their homes. So besides just consuming shelter, consumers were also using housing to fund other consumption, like ushing a HELOC to buy a SUV.
Over the last two years, particularly the last six months, consumers can no longer borrow against real estate to fund consumption and are in fact paying off a lot of their debt. The savings rate is increasing every quarter. Sure the high price of gas caused people to cut back some on consumption last summer, but that was nothing to how much they cut back on consumption this winter when oil prices dropped.
“It’s the fundamental input (i.e. energy) into every single productive activity in our economy. Raising the price by an order of magnitude is a huge, huge change in the price of a fundamental input to the economy (while the value of the outputs scarcely changed at all or even declined).”
I think what your equation is missing is the fact that as the cost of your input rises, there becomes an incentive to use it more efficiently.
http://earthtrends.wri.org/text/energy-resources/variable-668.html
In 1990 the US used 334 tons of oil per $1 million (in 2000 dollars) of GDP, in 2005 it used 188 tons of oil per $1 million (in 2000 dollars). The US requires about 44% less oil per unit of GDP then it did before. This trend is unlikely to reverse itself, and the more expensive energy becomes, the more efficiently it will be used.
Rillion — you’re right that efficiency has increased greatly in 30 years (2x by your metric). That helps a lot to offset the 7x-9x increase in the price of the input, no question about it. But eventually you get to the end of efficiency increases. Thermodynamics guarantees it. Likewise, consumption of oil (and energy) has risen every year without fail, except possibly this year. And no efficiency increase (which relies on technological advancements and behavior changes) can compensate for a 1-year doubling in the price of oil.
Its a very odd feature of human behavior, that even though the price of energy may rise, because we are able to use it more efficiently, consumption never actually goes down. We drive further, in bigger and more powerful cars because we can afford to thanks to efficiency gains. Houses are twice the size they were 30 years ago, and on and on.
Meanwhile new oil production coming online is falling below the rate at which existing oilfields are being depleted. The peak is estimated to have happened sometime in late 2006. I think we should be clear that the world will never run out of oil, the only question is: what will the price be of that last barrel? If we have to dig up every last square inch of Northern Albertan and Venezuelan oil sand, cook it using nuclear-powered refineries and ship it to San Francisco, we’ll do it, but that will be a high price to pay just so we can drive our Prii 60 miles up and down 280 every day. In that scenario, it might not make sense to produce goods in China (barring highly labor-intensive products) then ship them here because transport costs will obliterate any wage arbitrage. The entire global economy will, from necessity, undergo fundamental shifts in terms of where goods are produced as a result of high energy prices. I don’t think you can say that credit has the same impact.
And to be honest, I don’t think we’ve seen the end of credit expansion … governments are still spending like there’s no tomorrow and it seems like they will stop at nothing to keep doing so. Our golden state of California is the prime example of the incorrigible profligacy of government. (Canceling healthcare for poor kids? That’s borderline Medieval…)
In some sense I think you agree with me — if we used credit to mask structural flaws in our economy for the past 30 years, then surely the way forward is to address the underlying structural issues rather than trying to reanimate the credit zombie.
Rillion, that’s an awesome trend. However… how much of that 2005 GDP was credit-fueled?
Since we’ve been seeing 5+% reductions in GDP since mid-2008, I expect we’ll see that oil/GDP number rising pretty significantly. Doesn’t mean we’re suddenly using oil less efficiently!
Rillion, Thanks for digging up the data. As a point of clarification, the units are Tonnes of oil equivalent. My concern was that oil was simply being replaced by another energy source. That may be true, but the data validates your main point, which is that all energy sources are being used more efficiently. From the technical notes: Energy consumption per GDP is the amount of primary energy used per unit of income generated by a country’s economy. All primary sources of energy, including coal and coal products, oil and petroleum products, natural gas, nuclear, hydroelectric, etc. are included here. Enough for now, I have to check up on my e-slaves and make sure they are hard at work.
Sb – a lot but the credit trend has been happening since 1980.
http://www.chrismartenson.com/blog/crisis-explained-one-chart-debt-gdp/11570
A nice handy chart of the total credit market debt in the US economy compared to GDP.
So did anyone find a reason why the overall price change did better than each of the three tiers?
still can;t see how this could be the case….as I mentioned, I thought Case-Shiller was free of mix factors etc..
Something seems wrong.
“I thought Case-Shiller was free of mix factors”
It’s not, although it’s more resistant than a plain median. You’re seeing mix change from the low end to the high end.
It’s entirely possible to have values change from:
Sub-sample 1 80% at 50 -> 20% at 55
Sub-sample 2 20% at 40 -> 80% at 45
Total 100% at 48 -> 100% at 47
due to changing mix.
As long as the total number is somewhere inside the range of the tiers there’s no mathematical problem but the only thing that can explain that difference is mix.
diemos,
I think pornaddicts’s issue was with the change to the total being outside the change to any of the individual tiers, which is seemingly very counterintuitive. The S&P website has a lengthy description of the Case-Shiller methodology that I don’t have the patience to read and understand completely, but it seems like there could be a number of reasons for this kind of counterintuitive behavior.
http://www2.standardandpoors.com/spf/pdf/index/SP_CS_Home_Price_Indices_Methodology_Web.pdf
One thing that caught my eye glancing through their methodology document was the weighing of data points as used when calculating the index. (A data point would be a sales pair where the same house sold in, say, 2002 and then, say, in 2009 for, say, 10 percent more.) From what I understand, data points are given a weight between 1 and 0 with a lower weight given to data points that are way off the general market trend. Presumably, paying less attention to outliers can make up for non-apples comparisons that have slipped through other filters or transactions that are nontypical for whatever reason. However, once you introduce a weight formula that discounts transactions that deviate from the median, it’s easy to come up with examples of how the total could have a change that is outside that of any of the individual tiers.
I’m not saying that this is what is going on in this particular Case-Shiller report, just that it’s possible to come up with a simple mathematical example where a trivial formula for assigning weights to data points could result in a superficially counterintuitive result for the tiers versus the total.
Instead of taking a median of values the Case-Schiller takes a median of changes in values and then creates an index that has the same change in value. If different sub-samples have a different rate of change then you can get mix effects again.
If the same weights are being applied to the data points in the calculation of the total as in the calculation of the tiers then my original point stands.
If the tiers are treated as individual entities, the same formula for calculating weights could give a different weight to a data point within a tier than it would have in the total.
in that case, Case Shiller = not as good as I had first thought.
given its (a) affected by mix significantly – this month for example and (b) SF itself has around a 10% weight in the index, to me, its pretty useless for looking at what is going on in SF itself.
also, people are basically betting on future movements in the index right?
I would never want to bet on something that is so clearly affected by mix changes so much.
Any attempt to reduce a large heterogenous data set to a single number is going to lose information, by definition.
There’s nothing wrong with the Case-Schiller number. There’s nothing wrong with medians. Each number is what it is. But neither of those numbers is “SF real estate values” because “SF real estate values” doesn’t exist as a perfectly definable quantity.
The problem is always unrealistic expectations or misconceptions on the part of people trying to interperet those numbers. If you accept them for what they are and understand what they are then they give you more information than you would have without them.
So what can you determine from Case-Schiller? Well. Starting in 97 values went up a lot then in 06 they started going down and are still going down. That’s a pretty safe conclusion to draw from the data.
I could have told you that with or without the Case-Shiller index, though…
but this months result didn’t pass my 30 second sniff test, that’s for sure. And I was hungover.
actually, looked back over the last 9 or 10moonths and it seems this is pretty much always the case – the overall price change is greater than each of the 3 individual tiers.
about 6 or 7 months ago it was the case that the overall change was worse than each of the individual tiers.
It doesnt seem that resilient to changes in mi to me, quite the opposite in fact…
Doh. changes in mix.
Diemos,
CS is valid on many levels. Of course the closer you look at the phenomenon, the more likely you will be overwhelmed at the quantity of data as well as its apparent contradictions. We have a specialist. The main defense of some bulls has been to reply to macro trend with micro data points (often very valid).
But macro makes us understand the extent of the current correction and it’s impact on micro trends (it’s all connected after all).
Shiller made a graph in 2006 that was amended with the latest C&S data:
http://www.ritholtz.com/blog/wp-content/uploads/2009/06/case-shiller-updated.png
Scary stuff, isn’t it?
CS = invalid when talking about the subject this website is based upon, San Francisco. SFRs in SF = much of what makes up the city. And top tier on MSA = SF SFRs = “up MoM.”
anonanon, Thanks for bringing up the weighting. Also I now believe that the other factor coming into play is (from C/S Methodology): the price indices are value-weighted… Value-weighted repeat sales indices are analogous to capitalization-weighted stock market indices. Thus, more expensive properties can have a greater influence on the overall index. Will be interested to see if this momentum continues with the typical summer peak in July/August (bear in mind, the last downturn took 6 years and every summer there was a seasonal spike before the downward trend continued.)