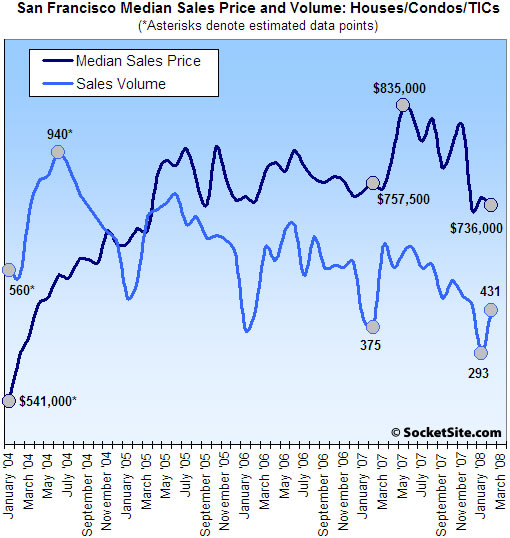
According to DataQuick, home sales volume in San Francisco jumped 14.9% on a year-over-year basis last month (431 recorded sales in February ’08 versus 375 sales in February ‘07) and jumped 47.1% compared to the month prior (293 recorded sales in January ‘08). And while a general increase in reported sales activity in San Francisco shouldn’t catch any plugged-in readers by surprise (we noted the upward trend two weeks ago, and of course seasonality is in effect with respect to month-over-month gains), the magnitude of the increase is sure to raise an eyebrow or two (as it should).
Keep in mind, however, that DataQuick reports recorded sales which not only includes activity in new developments, but contracts that were signed (sold?) many months or even years prior and are just now closing escrow (or being recorded). The sales reports from the San Francisco Association of Realtors will likely paint a very different picture in terms of February market activity (down ~22% according to one plugged-in reader). And it does raise the question of whether or not new developments are “stealing” transactions from the existing condo market.
The median sales price in February was $736,000, down 2.8% compared to February ’07 ($757,500) and down 1.1% compared to the month prior. That being said, we continue to see mix playing a significant role in supporting the median sales price in San Francisco.
For the greater Bay Area, sales volume in February was down 36.7% on a year-over-year basis but increased 11.2% from the month prior (3,989 recorded sales in February ’08 versus 6,305 in February ’07 and 3,586 this past January). The recorded median sales price fell 11.6% on a year-over-year basis and was down 0.4% compared to the month prior.
At the extreme, Alameda recorded a 44.5% year-over-year reduction in sales volume (a loss of 603 transactions) and a 16.8% drop in median sales price. And outside of San Francisco no Bay Area county reported a drop of less than 35% in sales volume, and not a single Bay Area county reported a positive change in Median Sales Price (with both Sonoma and Solano reporting drops of over 20%).
∙ Bay Area home sales remain at two-decade low [DataQuick]
∙ San Francisco Sales Activity In January: Down Again (-27.1% YOY) [SocketSite]
∙ SocketSite’s San Francisco Listed Housing Inventory Update: 3/03/08 [SocketSite]
∙ Infinity And One Rincon Hill: Closings By The Numbers To Date (2/29) [SocketSite]
I have to say though that I do not agree that the sales figures shouldnt be a surprise.
You reported an upward trend true, but stated that sales were still running 30% below 07 numbers – not 15% above them. That’s a HUGE swing.
For those interested, the mix in the price numbers is up 0.1% YOY for SFHs YOY, so I guess a 5% or so drop in condo/TIC prices YOY.
[Editor’s Note: We agree, it’s a huge swing. And considering it’s 49.9 points higher than any other Bay Area county, we think it’s worth trying to understand why.]
Isn’t this the first time sales have increased on a year over year basis in S.F. in four years?
I’m wondering if the new spin will be that the ORH and Infinity closings are distorting the “true” picture for the S.F. market? If so, I don’t buy it. Those buyers waited up to 2 years to close on those specific condos and thus were not buying somewhere else in the past 2 years. Everyone knew this year there would be hundreds of expensive ORH and Infinity (and Soma Grand etc..) condos closing, so should we discount the rest of 2008 numbers as unrepresentative of the market because of this new inventory?
Even the Dataquick press release notes the possibility of setting new record median prices this year if those new conforming loans actually make their way to buyers. I’m sure the realtors will be able to turn this into a “San Francisco has survived the housing crash” story if we get another month or two of numbers like these.
Wow, SF really IS different! Let me call up my mortgage broker and RE lawyer and get some offers out there …
Wow, I better just stop paying my mortgage now because the housing apocalypse is coming to San Francisco and all homeowners will lose 30% of the value of their home by the end of 2007, er, I mean 2008, or wait, 2009 for sure.
I just posted these numbers under the Mullin thread, but here are the MLS sales volumes for SFH’s and condos in San Francisco:
Feb08: 295
Feb07: 380
Feb06: 399
Jan08: 223
The DQ are usually somewhat higher than MLS presumably due to unlisted sales and maybe methodology. The delta for Feb08 is huge (136 units – nearly 50% higher than MLS) while it’s a -5 for Feb07. Can someone check my numbers? And maybe the Feb07 DQ number.
Don’t the MLS sales number miss new construction unless the specific unit is listed on the MLS? Some buildings will list a few units at a time, but others do not. Buildings like Soma Grand and Protrero I think always have a couple of units on the MLS but ORH and Infinity have no need (in theory) because they are presold. The reserved buildings will never show up in MLS stats but will show up in Dataquick because they go by recorded sales.
Given the number of units closing over the next 6 months or so at ORH and Infinity those 2 buildings alone could account for 80-100 recorded sales per month through the end of the summer- assuming of course that they all close.
With the ORH and Infinity closings I was expecting a bump up in median price. It’s going to be interesting to see what the MLS median is for February.
But surely its wrong to exclude these numbers?
Presumably they would have bought somewhere else (most likely a listed condo)if these new constructions hadn’t happened.
As Fluj posted elsewhere, listed SFH sales slightly up YOY. Listed condo sales way down (about 80 down YOY). But more than compensated for by these unlisted sales.
I just looked at February YoY for SF. There’s no real difference anywhere except condos. 137 SFRs sold last year. This year it was 144. Last year they averaged $621 a foot and around $1.1M. This year it was $604 and $1.15. That’s all pretty samey. Last year there were 30 2-4 unit buildings sold. This year it was 29. This year saw 13 5+ units sold, last year 10.
The big difference is condos. This year there were 158 sold, last year it was 236! They averaged 691 a foot last year and 645 this year. Average price also dropped from 827K to 766K.
I think what’s happening is what we all thought would happen. There is a bit of a condo saturation effect that’s underway. But I don’t think anybody can look at these numbers and honestly say the overall market has changed too much, other than what’s happening with condos.
“But I don’t think anybody can look at these numbers and honestly say the overall market has changed too much, other than what’s happening with condos.”
“137 SFRs last year”
“30 2-4 unit buildings last year”
“236 condos last year”.
So other than about 2/3 of the market last year, you’re right, not a whole lot has changed!
Wow, I sure am surprised by how hot the SFRE was in February. This changes everything.
I guess I better buy now or be priced out forever…
I’m still having trouble understanding the differences between the DQ and MLS numbers. Per MLS, Feb08 sales were 23% lower than Feb07. DQ shows a 15% gain. I don’t believe that unlisted sales can account for the discrepancy. Maybe there were 136 last month – but there must have been some last Feb (certainly more than zero or -5!) Volume of 295 units is extremely low for any month per historical MLS data.
I will review by district, but here are the overall median prices:
Feb08
SFH: 137 sales, $825K median
Condo: 158 sales, $755K median
Feb07
SFH: 144 sales, $843K median
Condo: 236 sales, $663K median
So the median price is down YOY for SFH (and way off the $965K from the peak of May07) but way up for condos (but still less than the $765K from May07).
Tipster, what do you mean to say? Because SFRs and 2-4s and 5+ were all the same pretty much.
O wait. I get it. You are now solely seizing upon condo sales as the beginning tell tale sign of Ragnarok. Aweshum.
Here are the Feb08 and Feb07 numbers with average prices added:
Feb08
SFH: 137 sales, $825K median, $1,153K ave
Condo: 158 sales, $755K median, $827K ave
Feb07
SFH: 144 sales, $843K median, $1,095K ave
Condo: 236 sales, $663K median, $766K ave
Wasn’t the rhetoric on here always that taking figures just off the MLS is extremely misleading??
and again it seems to be the case.
problem is basiclaly you are only working with a subset of the data, and there may be significant differences in what the remaining subset is made up of. (by district, type, size etc etc)
Behind these numbers Dataquick does have have SFHs split out, although I can never find this on its website.
Luckily the Chronicle reports:
http://www.sfgate.com/cgi-bin/article.cgi?f=/c/a/2008/03/14/MN9RVJAF6.DTL
Median SFH home price 800k up 0.1% YOY.
So condos/TICs will be down around 5% ish to give the overall -2.8% reported.
So a very different picture to the one you paint, and shows the danger in pulling conclucions from a subset of the full data. (eg your 843k for Feb 07 compared to what must have been really $799.
Dear flug, congratulations on a minorly obscure reference to Norse mythology!
From Wikipedia:
In Norse mythology, Ragnarök (“Fate of the Gods”) is the final battle waged between the Æsir, led by Odin, and the various forces of the giants or Jötnar, including Loki, followed by the destruction of the world and its subsequent rebirth.
In fact, some version of this is exactly what we’re hoping will happen in SF, sometime soon …
REpornaddict – MLS data for closed sales is extremely accurate. Where do you think DQ is getting their information? The 144 single-family homes that closed in Feb 2007 had a median price of $843K. The 137 that closed in Feb 2008 had a median price of $825K. These are 100% of the sales for the city and county of San Francisco per the MLS database. There may indeed be gaps in the MLS data, but, unless there were significant changes in the reporting methodology, the 08/07 comparisons are appropriate. And, at this aggregate level for SFH’s, the median price is DOWN compared to a year ago.
So why are Dataquick saying that the median price is up (albeit only 0.1%) compared to a year ago, not down? – and is 800k – not 825k?
And are you saying that condos have increased 14% YOY?
Then where did the Dataquick number overall for down 2.8% come from??
To me, the “answer” to why sales picked up month-over-month seems clear if you look at the graph kindly provided in the post. Every January shown (4 year’s worth) shows a sharp drop off, followed by a quick rebound in Feb-March. This year seems to be doing more of the same, but the overall long-term trend appears to have peaked and is in decline.
Put another way, if you ran that chart through a smoothing function (for instance, a 3 or 4 month running average chart), I’d imagine the long-term trend would be apparent, and that appears to me to be steady decline since 2004.
correct greater!
I argued in vain that the recent heavy falls in volumes may well be seasonal effects, but others pointed to a more doom and gloom scenario – which granted is true elsewhere in the Bay Area.
The pick up in Feb however disproves this.
Good questions REpornaddict – I actually placed a call to DataQuick (858-597-3100 – but I got their after hours message). I’m hoping to learn more about their data and methodology though I doubt they will disclose much. I’m surprised at the discrepancy v the MLS data this month. It really does lead to different conclusions (or at least different headlines).
Yup its interesting given the discrepancies.
Which, it looks like, existed in January as well with I think 293 (DQ) vs 223 (MLS).
Not as big a difference vs MLS as Feb, but still a huge difference from say, a year ago.
Pretty impressive SF Median prices is only down a little bit YoY, with the collapse in jumbo loans coming to a complete standstill. Why do you guys think that SF prices continue to go up?
We double-checked with DataQuick this morning (which is why we didn’t publish until this afternoon). The DataQuick sales data is based on recorded deeds (not MLS data) and their press releases include both existing home and new development transactions.
And once again, a contract that was signed at any time in the past but only closed escrow and was recorded with the county in February would be considered a February sale.
A steady overall decline since 2004? I thought we all pretty much agree that spring 2006 was the peak?
Here is a comparison of sales by district, Feb 08 v Feb 07, for single-family homes in SF (based, of course, on MLS data). The rows show MLS District #, Feb08 median price, (# of Feb08 sales), Feb07 median price, (# of Feb07 sales):
1: $1,300K (11) $1,325K (10)
2: $805K (27) $825K (35)
3: $570K (7) $660K (9)
4: $928K (23) $825K (25)
5: $1,500K (18) $1,315K (15)
6: $2,235K (2) $2,300K (2)
7: $2,491K (6) $2,800K (7)
8: $1,500K (3) $1,375K (2)
9: $863K (11) $820K (13)
10: $610 (29) $660K (26)
Total SFH in SF: $825K (137) $843K (144)
It’s great that there is something here for everybody – 6 districts showed a decline (#1,2,3,6,7,10) while 4 increased (#4,5,8,9). Note that some districts have very few SFH sales.
Thanks SocketSite for the info that DQ is based on recorded deeds. Wouldn’t this imply that the MLS data should be more timely – but wouldn’t it also be the same data? The MLS selling date is supposed to be the date of record for the close of escrow. The actual recording may take some time, but shouldn’t the close date remain unchanged even if the recording is made later? You would think that DQ’s counts would then be lower than MLS since they probably are missing sales that closed late in the month. If that is true, then it implies that the unlisted sales represent an even higher % of the total DQ count. It would be nice if they broke this out for us.
Something is happening, we just don’t know what yet.
fluj says:
“A steady overall decline since 2004? I thought we all pretty much agree that spring 2006 was the peak?”
fluj,
I am only making an observation on real data presented right here. Please look at the graph of home sales, try to draw a line/curve that approximates a “curvilinear fit” to that data, and see what you get. I find it hard to draw any curve that doesn’t decline from the left (2004) to the right (today).
Price, on the other hand, seems to have peaked on this graph in 2006, although I’d argue it’s still too early to make any definitive conclusions on trend.
Volume? Charts are only so useful because unlike pure numbers, RE does not exist in a vaccuum. You know property was quite a bit cheaper in 2004, right? The cheaper things are the more people can afford them. And 2005 and 2006 suffered from a lack of inventory. I don’t care what the chart shows. A “steady decline since 2004” is not reality.
You don’t care what the data shows. Deflujional — Numbers don’t lie.
It’s to bad all the data that has been posted above is inaccurate.
1. Data Quick claims that their sales data comes from the San Francisco Recorders office. True, but many new projects and some of the data from the San Francisco Board of Realtors is not accurate.
Most developments of new homes, condo’s etc. are not published by new home developers. The developers realize that this information may not be advantageous to them, as buyers that discovered the real selling price may be motivated to try to obtain similar terms.
Both the St Regis and Four Seasons projects have never released the original selling prices. 733 Front Street did not release the actual sales data for 6 months after the sales had closed.
It was years before the original selling prices of most of the new condo’s that were sold in SOMA from 1995 to 2007 were available from the recorders office. I know as I have spent 100’s of hours trying to get this data from the Assessor, various title companies and the SF MLS.
The data collecting firms (Data Quick, Metro Scan and others) only read the amount of the tax stamps paid which is recorded on the front of the deed. Various developers and some re-sale transactions, record the tax stamps on the reverse of the deed or on another document at the time of the recording. This confuses the data companies, so they do not do the research as to those deeds that do not have the tax stamps on the front.
The SF Assessor’s office usually picks this up within a year or sometimes two years, but Data Quick has never gone back and revised their data.
Therefore the data Data Quick is claiming is “accurate” is missing most of the new sales that are closing escrow now, that do not put the transfer tax amount on the front of the deed.
A Seller and/or Buyer of a resale property may decide not to disclose the selling price, which is legal. There are numerous transactions that are sales and are recorded, but the actual sales price is not reported by the data collecting companies. Brokers that have Buyers/Sellers and their attorneys that want this information to remain confidential will usually allow a MLS listing to expire or withdraw it so the data is not reported to the MLS. The MLS allow the Brokers to report the selling price and sale date, but do not require that information to be exact (they do not review the deed tax stamps or the deed to confirm the exact date). Some sales are not reported by Brokers for weeks and even months after the sale.
This is the United States where most information is private, if the parties to that information choose to have the info remain private.
The SF Assessor’s Office has the right to and demands of the Escrow Company to find out the selling price so that they may adjust the future property taxes that are collected. But they do not have the right to collect this information and sell it to who ever wants to pay the Assessor’s Office for the (a) sales price, (b) loan amount(s), (c) beds, baths, etc. Yet the Assessor’s office asks the Escrow companies to have the Buyer sign a document that provides this information to the Assessor.
This information is highly valuable to the data collectors as they can re-sell the data to various commercial parties (lenders, credit companies, real estate brokers & regional MLS & many other financial entities).
So, the data is not exact, yet because the misinformation has been consistent, perhaps it does not matter.
But if you want to see if Data Quick is including sale of new homes/condo’s in SF, you should ask to see their data. My bet in ORH, the Infinity, and all the rest of new product are not included in their data, unless those sales have the tax stamps on the front of the deeds and the data collectors have acutally included it.
And finally, according to the SFMLS, the Feb 2008, single family homes and condominiums sales were 295, while 2007 were 394. This reflects a 22% reduction in the amount of sales reported by MLS. The median selling price increased by 4.2% from 2007 ($753K) to 2008 ($785K).
Frederick
Guys,
no reasons to publish Ph.D. theses here. Just read the headline news in the WSJ or FT and you know where the RE market is headed.
Enjoy the ride!
fluj says:
“Volume? Charts are only so useful because unlike pure numbers, RE does not exist in a vaccuum. You know property was quite a bit cheaper in 2004, right? The cheaper things are the more people can afford them. And 2005 and 2006 suffered from a lack of inventory. I don’t care what the chart shows. A “steady decline since 2004″ is not reality.”
fluj,
As a new poster, long-time lurker, I’ve appreciated most of your comments. However, this one doesn’t make sense.
Data, if gathered reliably, should certainly provide SOME information, although of course it’s not the whole story. In fact, I’m not at all advocating overinterpreting this data. You, on the other hand, provide explanations for why these numbers are the way they are (low inventory, blah blah). However, numbers are numbers. A “steady decline (in sales) since 2004” IS reality. It’s the hard, cold data. I fail to see any alternative interpretation of this data.
Sure data is important! But don’t call it the end all be all, because it aint. You cannot discount median gain entirely, nor can you base your opinion solely on volume. The person I was engaging was going on volume, period. Come on. That was not what happened. Those of us in the trenches knew that properties were seeing six, seven offers. Why? Lack of inventory. Do not discount that. Believe what you will. I know what happened. I don’t really have an agenda on here. Have any of you ever seen me solicit? No. You have not.
Seriously, 2004 was the peak? that isn’t even remotely credible in any way, shape, or form. I mean. Shoot. That is pure crap-ola by even SS bear overstatement standards.
Greater fool’s contributions are a welcome addition to the discussions on statistics we sometimes engage in on this site. Anyone who understands smoothing functions and curvilinear fits is going to get terribly frustrated (as I get) in trying to get his or her point across! I suspect any real appreciation of statistics and how to interpret data is well beyond the scope of most of the salespeople involved in real estate (most, not all, and FSBO in particular seems on the ball and well versed in these ideas).
fluj,
When GF talks about the “peak”, Greater fool is talking about VOLUME. VOLUME. That is indiputably true when looking at the graph presented above (which only goes back to 2004).
Volume is important, because it provides the background with which to interpret statistics like median, average, etc. – when you are dealing with heterogeneous assets (that is, assets whose characteristics vary dramatically from one another). As you know, even median by district doesn’t tell you too much about what is happening with any particular asset/house – and THAT is what any owner or potential buyer cares about. Median does have some value, of course, but it is limited.
On a different thread, someone pointed out that he was tired of the “bears” talking about “mix” on the way up, and on the way down (in terms of median price). He seems to think it doesn’t work in both directions. Again, this shows a fundamental misunderstanding about how statistics works, and explains why Greater fool’s comments aren’t immediately understood as correct. Mix matters on the way up AND the way down because, well, mix MATTERS when you are dealing with a set of heterogeneous assets. It is a characteristic of the data set (sales of heterogeneous assets), and hence is ALWAYS a consideration.
But, all that being said, in a very rough way and OVER TIME, median is probably a somewhat reasonable proxy for what is happening, although of course inexact. Just looking at the chart above, if you think median is important and a reasonable proxy, it looks like SF prices have gone NOWHERE since about April 2005. 3 YEARS of ZERO appreciation, if you believe medians. I bet the realtors talk about “mix” when some client brings up that stat! (hehehehehe)
Yep on volume. With like kind #s, it really gives the best indicator as to what’s happening. I’d argue if you examine that trend line in both volume and price, and if you adjust for distributions in price we are probably already down 10% on most price ranges of homes in SFO. And we are probably heading down 15 to 20% over the next 2-3 years followed by 3-5 years of flat prices. i.e. I’d disagree slightly with Satchel and say I think prices are not flat, but have declined rather since 2005. At this point, I am not even really rooting for huge price declnes any more. It’s really hurting the country–the collapse of bear on Friday was really ugly to watch. And I had a ton of puts on too –the gain in my portfolio is far far outweighted by the reputational hit to the country. This frankly is pretty disgusting to watch at this point.
fluj,
Calm down! As I’ve already stated twice, I am only making a simple, direct observation on the above data. I have made no conclusions at all about the overall market, as I have little experience with that, particularly compared to you. Moreover, I never claimed it was the “end all be all.”
satchel and cooper,
Thanks for the comments! There are awesome discussions on this site.
“10: $610 (29) $660K (26)”
(2/08 vs 2/07 District 10 sales)
In comparing 2/08 with 2/07, mix might not be much of a factor. While mix may still be a factor in comparing 2008 with 2006 or 2005, it appears that the ratio of sales in District 10 to sales in the more expensive districts has stabilized. Indeed, District 10 represented a higher share of total SF SFR sales in 2/08 than in 2/07, at least according to these numbers.
But do you guys understand, or not, that pure volume can also have the inverse effect? When there is not enough housing to match demand this will increase price. That is a trend that was ongoing literally for a few years. I have heard from some agents and buyers that it is even happening right now, for flawless properties. You must process it all: volume, price, everything. What I reacted to was a flat dismissal of price in favor of volume.
With all the data that SocketSite gathers I’m sure it should be possible to chart a volume of sales Vs. volume of available inventory over time to test Fluj’s hypothesis.
Any takers?
C’mon you guys fluj is 100% correct.
2004-2006 numbers represented a restriction on the number of homes for sale. Almost every home listed sold. “Offers due Tuesday!”
You can’t say that that had anything to do with declining demand. It had to do with the fact that everyone thought their home price would rise forever and they didn’t want to sell. Every realtor can tell you they could have sold 5 houses in 2005 for every house that sold.
This is a different market now. One has nothing to do with the other. You can’t have experienced the market in 2005 and claim that the market has been declining since 2004. But that’s exactly how it appears from the graph.
I think that graph is an imperfect indicator of the true state of the market.
And look at it: it seems to dip around the beginning of the year, and then pop back up. This year, it dips earlier and pops up earlier. What does that mean? Probably nothing with respect to the health of the market.
And how meaningful is it to the current market that a bunch of condos that were sold a year ago or more are closing. And their prices are prices from a different era, so how meaningful is that? When there is a hugs spike up next month because 1RH and infinity close will that mean the market is on fire? No more than the next month or two later when it will take a big drop because that spike isn’t there.
fluj is 100% correct. He lives and breathes the market. The chart has all sorts of inaccuracies built into it.
fluj,
That’s an interesting hypothesis that certainly makes common sense – essentially you are invoking typical supply/demand forces. IF Socketsite/DQ/etc.’s data sets are robust enough, one might be able to test that hypothesis.
My overall suspicion however, is that there is just not enough data to reliably draw those specific conclusions. Many here gravitate towards comparing sales across specific SF districts. When that is done, the numbers are so small that the confidence intervals become prohibitive. I’d venture that even taking aggregate SF sales data may not be enough data for robust conclusions.
However, of course we here all love to hypothesize and speculate on the bits and pieces of data we do have in front of us. That’s of course interesting and fun, but it’s good to keep in mind the incompleteness of that data.
In the end, if one were to try and take a purely quantitative approach to the real estate market in SF, there are probably too many variables and too much human influence to be able to draw conclusions and make predictions with any high degree of accuracy. In addition to sales volume, sales price, and as you mention home quality, there are all the usual macro and micro economic factors that influence the market: buyer/seller psychology, economic trends, changing desirability of micromarkets, etc etc.
When we finally figure out how to account for all these factors in a model, it will probably be the same day we’ll have learned how to predict the stock market, earthquakes and the weather accurately. 🙂
Nice one greater fool. Yeah, there is no charting humanity in the end. Right? I am definitely one to put more on individual neighborhood data than anything else. Unfortunately for the sake of discussion the numbers are rarely enough to constitute datasets. However, in practice, knowing what something similar sold for a week or two ago is 90% of what I work with.
I agree that trend analysis is important. The downward volume trend is significant and indisputable. And now prices seem to be trending down – at least at the aggregate median level. Our favorite district 5c (Noe Valley) continues to defy gravity, but outside of few such pockets there is an increasing amount of apples-to-apples evidence that support the overall data and the conclusion of declining prices.
Frederick – thank you for your comments about limitations on the data. It really helped my understanding of the issues. I agree with your comment that the data are still valid since missing data points are probably relatively consistent over time. There may be some bias introduced if big condo projects suppress data, but the resales eventually get into the MLS database. Regarding the Four Seasons (765 Market), it looks like all the units are now available on Property Shark and most have some type of listing (active, sold, withdrawn, etc) on MLS. The St Regis (188 Minna) doesn’t show up on Property Shark, but there are now many listings on MLS.
What’s the motivation for suppression? I support the point that you made that this is America and we should be entitled to privacy, but isn’t the primary motivation (by sellers and developers and their agents) to not reveal the selling price is to inflate the perception of selling price? Sure, I can understand the ultra rich not wanting their transaction prices to be made public (eg Al Gore probably would prefer that we not know how much he paid to extend his big fat carbon footprint to the St Regis). Overall, my sense is that there are not a lot of gaps or bias in the MLS data. For many properties, I have compared the selling date and selling price from MLS with other sources such as Property Shark and the data almost always matches. I rarely see a selling price discrepancy although on a few occasions I’ve seen the recorded closing date differ from the MLS selling date (usually offset by a few weeks at most). So I feel that MLS anaysis is a valuable tool – with the understanding that it is listed transactions only. It should closely match the DQ data since, as you point out, DQ has no way to capture selling prices from suppressed recordings.
I am still quite puzzled over the diffences between the Feb08 / Feb07 comparisons using MLS and DQ data. MLS indicates a clear 22% decline in volume (295 sales in Feb 08 v 380 in Feb 07) while DQ is stating a 15% increase. I can’t believe that any time shifting of recording dates could account for this difference.
Not to quibble with your numbers (but I am a data guy so I’m always checking my numbers), but I believe that the Feb 07 figures that you cite in your post (394 sales at $753K median price) are actually for the period 2/1/2007 – 3/1/2007. My Feb 07 figures (380 sales at $762.5K) were for 2/1/07-2/28/07 only and didn’t include Mar 1.
One thing is certain, rent is up HUGE over the past couple of years, while SF prices are up only about 5-10% in the past 16-20 months. Can we all agree on this, as a majority of renters here, including Adam?
@anon ^^^
Even with the rise in rents, it cost 50% to 100% more to own. I have been running some rent vs buy comparisons and just don’t see a way to justify buying 🙁
Yes, rents are up about 9% last year (obviously, as people stop buying, rents will spike up for a bit), but that appears to be slowing and vacancies are rising. The fact is that the whole area has seen a lot of building, without much in the way of job increases, so that oversupply will take a while to work its way out of the system. And as people sell their second homes, or give up and rent them, inventory will continue to rise.
The last article from RealFacts is about 2 months old, but its predictions match the dramatic rise in Craigslist postings for rent in SF that have been going on for awhile.
http://www.realfacts.com/1172008.html
And we just ended our campus recruiting yesterday. I can see from the resumes that we got that there won’t be a lot of hiring in the bay area this year. We got a lot of resumes from people who you could see were progressing towards a certain field who suddenly switched into ours. That usually happens when the other field stops hiring.
We got them from a lot of fields other than ours this year, but I can say with certainty that anyone who did two or more internships with an investment bank doesn’t appear to be finding a lot of job prospects in their chosen field this year.
Little hiring = little renting this spring.
Deflujional–I’d go with not. And no volume is not dropping now because prices are rising. It’s possible to see declines in volume when nobody wants to sell and prices are ramping up fast..but that’s not what is occuring now or in the last 3 years. When that occurs, you’ll see that in price volume data for a year maybe –not 3-4 years….and when the volume goes up you won’t see flat to down pricing. Prices of all assets are pretty much going to go through a depression like spiral. Read the WSJ today–they have a great articile–US Margin Call. This really is not going to end well. And no I’m not happy about it.
Fluj Said “But do you guys understand, or not, that pure volume can also have the inverse effect? When there is not enough housing to match demand this will increase price. That is a trend that was ongoing literally for a few years. I have heard from some agents and buyers that it is even happening right now, for flawless properties. You must process it all: volume, price, everything. What I reacted to was a flat dismissal of price in favor of volume.”
Yeah, well, it happened Cooper. I was there. Were you?
It’s what you think happened, or what you talked yourself into thinking was happening. It hasn’t quite hit you that what you thought was healthy really wasn’t. Upticks, let alone downticks in price on substantial declining volume over long periods of time is not healthy. Believe me, I am not rooting for a depression in real estate prices…it will be painful for real esate I hold as well as assets held in general. But someone let the inmates run the prison for the last 8 years and now the price is going to be extracted. We just had bear stearns collapse–that’s been around for what 80 years or something? We are about 15% of the way through this crisis–1-2 more years of contraction and deleveraging. The entire mortgage industry is gone in the course of the last 9 months. All those companies banrupt or folded. But yeah–real estate will snap back any second now.
Two things. You’re seemingly denying that there was a supply problem over the last few years. That’s not a credible opinion. It was a reality and you can talk it in circles if you like, but it strains your credulity. Second, you continue to write as if SF has already seen some sort of gigantic shift. RE will snap back any second now? From what? From these normal YoY numbers that are at the root of this topic of discussion? No. The sole shift in the market for the most part, right now, is that there is more condo supply.
Actually, my rent has been flat for the past two years.
So rent for other people may be “up huge” but not in my ‘hood.
Oh yeah, no rent control in my building either (built 1980).
Its a YOY and a trend discussion over the life of the chart. You keep hanging your hat on the condo market being the only bad park and that single family homes are doing great. But the only saving grace of the YOY data is you got un uptick from closing signed up for 2 years ago. 70% of the ORH are investors–who are not going to have a super good time trying to flip those condos which even you admit are not in good shape. Moreover, condos over time ALWAYS lead single family home data. And looking from the price data before even these condo sales started closing after 2-3 years, they sure don’t look like they were pricing up…quite the opposite. I wish I even had a shred of doubt at this point that all markets, eventually even NYC will completely crash in a 20-30% decline. SFO, like I said to you before I believe is already 10% there on old data, and by this summer maybe down to 20%….or worse. The only thing I don’t know, is when you are going to give your position which is totally unsupported by financial realities, current mortgage and financial markets, historical data or even the chart right in front of you. I think it would be fun to have like a socketsite poll–like when you are going to finally admit you’ve been wrong. I’d guess it’s gonna take June or July—once the summer season implodes here and foreclosures ramp up I think you’ll be ready to give everyone the satisfaction they deserve:)
You guys can fight about the data one way or another, but its basically just a wiggly line going nowhere in particular since 2005. (That is my professional opinion as someone with a Ph.D in engineering).
Every SF bear is waiting to see what will happen when/if massive numbers of Option-ARM resets start to become a factor in the market. Will everyone just refi into a 30-year fixed with no problems? Or will the world end?
A looming mass-reset in mortgages in the city of SF doesn’t bode well for the future but the data now doesn’t reflect any weakness AT ALL. Just business as usual: an expensive city with tons of rich people trading houses.
Gotta wait until 2009 to see if it happens. Come back next year. This isn’t Oakland– subprime isn’t a factor in SF real estate. Even the super-duper bears should recognize that.
However, anecdotally– friends in the i-banking sector say their compensation is expected to drop 60-75% this year compared to last. Many of them are retreating back to NYC to join a hedge fund or whatever…
I can’t recall if investment banking is a big sector of the SF city economy or not, though.
SF is already down 10 points, with another 20 to come. Cooper my man you make Satchel look like David Lereah.
Jimmy says:
“However, anecdotally– friends in the i-banking sector say their compensation is expected to drop 60-75% this year compared to last. Many of them are retreating back to NYC to join a hedge fund or whatever…”
Jimmy,
That sure sounds like a dicey proposition. There may not be many hedgie jobs available right now or any time soon. This credit unwind will affect HF’s, which are incredibly leveraged, in a huge way.
Actually the rental vacancy rate is up in the city and the rent price spike is expected to decrease over the next year. from all of the analysis i’ve done while looking at buying, the cost of buying 2.5x what i pay for rent. the RE prices need to come down 40% to justify the buying. However, i will be tempted once SF gets its 25% haircut ffrom the Q2 07 peak.
All i-bankers repeat to themselves endlessly the mantra “it’s a zero-sum game.” Which I suppose means that if they end up working at the counterparty to all these losing trades, they’ll be rolling in money…
That hypothesis seems pretty fishy to me but who really knows?
I think that all lines are now trending down for San Francisco: sales volume, median prices, asking rents, and occupancy rates. Craigslist listings are up and rents are coming down – a least a little. Supply of all types is still limited and our local economy is still pretty good, but all of the positive factors that have aligned to raise rents and keep housing prices high are turning negative. Tipster and others have pointed out hiring issues. Check out the WSJ article that Cooper mentioned. Here’s the link if I did it right:
It’s a pretty frightening article. (But you can’t say that Satchel didn’t warn us.) I still believe that our surrounding area (and most of the rest of the country) will continue decline much faster than here. But a larger price differential can’t be sustained forever. We have to eventually drop in somewhat relative proportion to the rest of the US unless there is some fundamental change in the demographics and desirability factor for San Francisco. I just read where Schwab is pulling positions out of SF and moving them to other cities (and vacating prime commercial space in the FiDi). It’s a minor event at this point – but it may be a trend.
OK here is the WSJ article link in text:
http://online.wsj.com/article/SB120554473788438679.html?mod=hps_us_whats_news
Plain and simple. DO NOT TRUST Dataquick’s info. $100,000 drop in SF median price from 10 months ago with at least another $100,000 drop for the next year.
fluj:
1) I agree with you (and others) that one must not make too much of this data.
2) however, there’s one point I’m not understanding in your argument:
I agree with you (if I understand you) that supply was severly constrained in 2005-2006. This would have held down sales in that time period, because there literally were 50 buyers for each house. It was so bad that people were willing to go into a contract for a building 2 years out!
So this would make sense why sales are DOWN in 2005-2006.
However, inventory is up the last 1 year… so one would assume that sales could go up too, right?
but when I look at every March… March 2004 was way highest in sales, March 2005 and 2006 are much lower (likely because there was no inventory to sell), perhaps that is the same reason for March 2007 as well… but then March 2008 isn’t there a lot more inventory again? wouldn’t we expect a bigger bounce?
or are you thinking that there’s still not comparable inventory in March 2008 compared to March 2004 (so thus, we’re still supply constrained)?
Also:
I both DISCOUNT and RECOGNIZE the ORH and Infinity sales.
I DISCOUNT those sales because many of them really went into contract 1-2 years ago… so if I were to look at the current health of the SF market I’d want to see what is selling now not what sold 2 years ago and just closed last month.
however, I also RECOGNIZE those sales as important because the buyers could walk…it’s not a done deal until it’s a done deal. The deposits however skew this a little (I’m sure a lot of people will close with buyer’s remorse)
I also don’t think one can call an area “strong” if condo sales are doing very poorly, especially when condos are 2/3rds of the market.
Condos are a replacement product for SFHs. Obviously condos come at a discount to SFHs, but their prices are linked. (I mean, would you pay $2,000,000 for an SFH if there was a condo right next door for $1?)
IF condos get cheap enough, it will put a drag on SFHs as well… But SFHs always weather the storm compared to condos. Every boom condos shoot up, and every boom people rationalize why condos will hold their value this time, and every bust condos collapse the most.
The big question: will this RE downturn (that has barely affected SF) last long enough to affect SF significantly.
my answer has always been yes, but who knows? Bear Stearns failing and getting a huge Fed bailout on Friday definitely wasn’t a good sign for mortgage lending.
for all of you happy that the govt is doing all these interventions: do you realize that our dollar is plummeting in value (15-20% in just the last 6 months) so that we can bailout all these Wall Street FatCats and overextended homeowners?
Ex SF-er, demand has slackened somewhat though. Remember my initial argument was counter to a statement that the last four years have seen a slow decline. That was not the big picture, because demand so great that it could probably best be understood in terms of price. I started off talking about ’05 and ’06 being what they were. Even onto the spring of ’07 too. But once the bad news started happening around the end of the Q3 ’07 demand started to decrease a bit. That in turn resulted in more supply. Some would still argue that there is not enough top shelf supply, or (non horrid) sub 800K supply, to meet demand. I think the sub 800K shortage has a lot to do with why we still see hypercompetitive Sunset and Bernal Heights properties from time to time.
We’re moving comments related to Bear Stearns and government intervention to: Sunday Night Special: The Bear Stearns Blowup And Balance Sheets.
And now back to the DataQuick data…
Wow…so many ardent opinions above, yet one angle remains unexplored. Putting on my tin foil hat here…
If you’ve been paying attention to foreclosures, you’d notice that they were up sharply in February. Countrywide’s foreclosure rate literally doubled last month. Gotta think other lenders saw similar stats. Even here in magical San Francisco.
What happens when a property goes REO? It gets counted as a sale at the county recorder level when the property reverts to the lender. I don’t believe it gets counted as a sale at the MLS level, though. Just one possible theory of why DQ sales numbers are so much higher than MLS: rising foreclosures.
Additionally, when that happens, the sales price is listed as the existing mortgage balance for recording purposes. Now, if the property was at least worth the mortgage, the owner could have sold it, right? But since they mailed the keys in, the value has obviously fallen. So median price per DQ will be overstated, along with sales numbers, if my pet theory is even partly accurate. Just a thought. Guess we’ll find out when DQ reports Q1 foreclosure numbers in April.