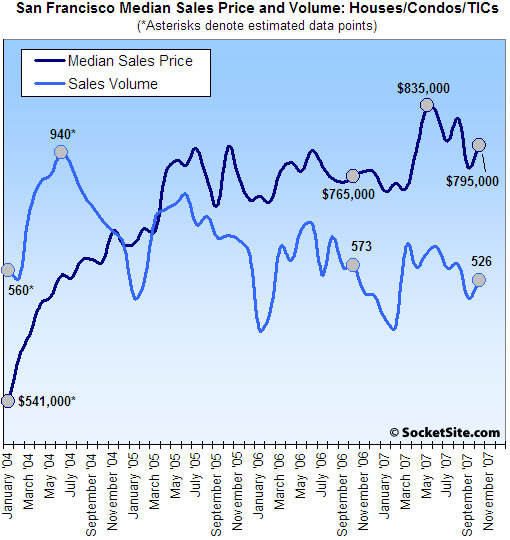
According to DataQuick, sales volume (i.e., demand last month) for existing homes in San Francisco fell 8.2% on a year-over-year basis last month (526 sales in October ’07 versus a revised 573 sales in October ’06) but rose 12.2% compared to the month prior (469 recorded sales in September ‘07). At the same time, the median sales price in October was $795,000, up 3.9% compared to a revised October ’06 ($765,000) and up 2.8% compared to the month prior. (And yes, we’re still thinking mix.)
And as we noted yesterday, the question remains, did the mortgage meltdown in August simply delay purchases/closings (which would have pushed September volume into October), or is sales activity in San Francisco actually picking up?
While there is always a seasonal decline in sales from summer to fall, home purchases that were financed with mortgages for more than $417,000, so-called “jumbos”, have dropped in half. Homes purchased with conforming loans have increased 12 percent.
For the greater Bay Area, sales volume in October was down 35.7% on a year-over-year basis (again, not a typo) but rose 9.4% from the month prior (5,486 recorded sales in October ’07 versus a revised 8,532 in October ’06 and 5,014 this past September). The recorded median sales price rose a nominal 1.0% as compared to the month prior, and was up 2.4% on a revised year-over-year basis.
Outside of San Francisco county, the smallest drop in year-over-year sales volume was recorded in Marin (down 28.7%) and the largest in Napa (down 53.9%).
∙ Bay Area home sales drag along bottom [DQNews]
∙ San Francisco’s Sales Volume Falls, Broader Bay Area Plummets [SocketSite]
∙ Listed San Francisco Home Sales Volume Up And Down In October [SocketSite]
This caveat of “different mix” is only going work for so long. If people started saying “different mix” a year ago, then it is actually the same mix now as a year ago.
It’s not like the mix changes radically on a month to month basis.
Nice numbers, just as expected, a solid bounce in prices and volumes from the low of September. Very healthy recovery.
I agree with the previous poster’s comments. And as I said last month, mix works both ways. Given the lack of availability of non-comforming loans, you would expect mix to actually have negatively impacted these numbers. This also supports the Case-Schiller link that was posted here a few days ago. Higher price properties and locales (e.g. – San Francisco), likely won’t experience much of a drop in prices, as they historically didn’t appreciate as much. In fact, they seem to be increasing in price over the last few months. I know a lot of you will disagree with me, but the statistics up to this point are leaning my way.
It’s a dead cat bounce. Prices are going down. Just be patient.
Does anyone have a 20 year sales volume history for San Francisco? One key to figuring out whether prices will stagnate/fall or continue to rise is whether or not the downward trend in volume over the past three years is dip below recent historical norms or a return to normal. Since housing stock in SF hasn’t grown too much (until the past year or so) the raw numbers should give a pretty accurate picture.
Owners: “Prices are going up, see?!”
Renters: “Prices will be going down any minute now, just wait…”
Repeat ad nauseum…
This data shows no trend in either direction. Its just “noise.”
“but the statistics up to this point are leaning my way.”
No they are not.
You guys don’t seem to understand what is meant by “mix”, and this seems to be another example of the same confusion about the definition of “median” that have had some of us banging our heads against the wall for what seems like forever.
OK one more time:
Scenario 1
If you have 1,000 properties sell for $1,000, then the median is $1,000 and the average is $1,000.
Scenario 2
If you have 999 properties sell for $1,000, and one property sell for $2,000,000 then the median is still $1,000, but the average is now $2,999.
Scenario 3 (i.e. the “mix” scenario)
If you have 250 properties sell for $500, 250 properties for sell $1000, 250 properties sell for $2000, and 250 properties sell for $1 million, then your median is $1500, and your average is $250,875.
Obviously no one is buying a house for $250k in scenario 3, they are either paying a lot less, or a lot more, and that’s why medians are used more often then averages in RE, because it tells us what people are actually paying, and it’s a lot less susceptible to being manipulated by the top 2%.
Now, using these same scenarios, let’s say all properties go down in price by 20% and also the bottom portion of the market doesn’t sell at all due to a 25% reduction in sales volume.
What does that do to our medians and averages?
Scenario 1
Median and average both drop to $800.
Scenario 2
Median drops to $800, average drops to $2932
Scenario 3 (i.e. the “mix” scenario)
Despite a catastrophic bust in real estate, the median has risen to $2000, and the average has also risen to a whopping $534,000. Weird isn’t it? Prices are down 20% and sales volume is down 25%, but the median went up 33%, and the average went up 112%!
So now, at long last, do you finally get it? When you have a relatively small sample size like we have in SF, and wide variances in pricing tiers based on micro-neighborhoods, it is really difficult to extract anything useful out of a city wide median or average, and that’s assuming all things are equal. Add in the value of property improvements and it’s just plain impossible. Prices could be going up city wide, or just in nice neighborhoods, the lower priced property could just not be selling at all, quality could be improving, or it could be a mixture of any or all of these. There’s no way to tell just by looking at median prices.
The only meaningful measure we have here is sales volume. That is a large enough sample set to tell us something. And it tells us quite clearly that buyers are staying away in droves. When I see posts saying that 35% down YOY is a “healthy recovery” simply because it is up 20% over last month, I’m sorry but I have to bust out laughing.
Looking at the data it’s clear there is a lot of month to month variation. Was August to September of 06 a “healthy recovery”? And if so then why was September 07 down so much from 06?
My impression is that the median is getting increasingly erratic and unstable, but the volume has been steadily trending downwards for several years. Buyers are voting on prices by not buying, and sellers are finding themselves in an increasingly precarious position. From what I can tell, buyers in less wealthy neighborhoods who have less maneuvering room are already blinking.
Meanwhile the upper tiers are holding out for, and in many cases still getting, appreciation.
No one, and I mean no one, knows what the market will do from here, but I think further high gains are the least likely outcome.
The mix comment is accurate and is indeed driving the discrepancy. Look at our neighbors in San Mateo. Their median home price recently crossed $1 million. WOW! The market must be on fire! Their median home price is even higher than here in San Francisco!
Except that home prices have fallen 14% in Daly City, 10% in San Bruno, and more than 20% in East Palo Alto. So how can the county median be rising?
“Real estate agents cautioned that the soaring median price does not reflect growing home appreciation across the county. It’s more a product of solid sales of high-priced homes, which skews the median price upward.”
http://www.insidebayarea.com/sanmateocountytimes/localnews/ci_7414819
I would offer that the prices in “prime” (i.e. those supposedly skewing these medians) SF areas will be more greatly impacted by a slowing economy or an economy in recession than anything happening in surrounding ‘hoods such as Daly City, San Bruno, E. Palo Alto, etc. No matter how much prices fall in places like Daly City, certain demographics will never consider them in the buy/rent equation.
Also, everyone on here likes to say things seep, but these data indicate the opposite is happening. At least to my untrained eyes.
missionite,
i understand your your logic in your example.
Is your explanation the only way you get to median prices increasing in a declining sales volume market? Or are there other possible scenarios.
I am just trying to understand all the math and I am not good at this stuff. thanks for the explanation in advance.
*Sarcasm Alert*
With sales volume off 35%, that’s some “very healthy recovery” we have going there!
The reality is that the mix continues to evolve. When things are booming and loans are easy to get, you might buy something on a busy street just to get in at your price range and figure you’ll just sell it next year and trade up.
Nowadays, that type of thinking is history: people are looking at buying places they can stay in for awhile, at least long enough to ride out a downturn. That means a single person might buy a 2bd condo instead of a 1bd, a small family might insist on a house, not a condo. So people are spending more, but fewer people are buying.
The mix will continue to evolve. Anyone who rate locked for 90 days in mid august just as things were melting down and the mortgage brokers called everyone and their brother and told them to lock, could have closed as late as mid November. Those people also would be buying something they could stay in, as they knew they were not going to qualify for another loan for many years. Although many of them already likely bought before October, there were still people in the market in October and half of November who will be out of the December stats entirely.
The December stats will be much more meaningful. The markets have calmed down, interest rates have calmed down, and the rate lock crowd will be gone. Until then, the numbers have been gyrating for too many reasons to be able to yield any useful information one way or the other.
I *am* surprised that volumes were down that far. But again: weird month. Too tough to read anything into these tea leaves.
Well, Dataquick says it pretty clearly in that report:
“higher-priced areas are not seeing the price declines”
DataQuick isn’t seeing MEDIAN sales price declines in the higher-priced areas. I’ll save myself some typing and just say see missionite’s comment above.
Once again, the quantity of houses sold– sales volume– is not the same as demand. It is the quantity at which supply and demand meet.
The quantity of houses sold = quantity demanded, AND
The quantity of houses sold = quantity supplied TOO.
“Demand” and “Supply” are different than “quantity demanded” and “quantity supplied.”
You are talking about Q on the following pages:
http://en.wikipedia.org/wiki/Supply_and_demand
Market demand, on the other hand, will be determined by things such as availability of financing, job growth, population growth, changes in preferences: things exogenous to the graph.
How about someone posts Median and Mean prices for some area (any area) and then we can argue about how ‘skewed’ the distribution of prices is?
That’ll be fun!
You could even normalize it in terms of median price per square foot vs. mean $/sf.
Jimmy-
Here’s a link to trulia’s San Francisco Market Trends, which is based off of sold and listed homes. Click through the blue tabs on the left if you want to see average vs. median vs. per square foot. Basic trend is that prices are coming down, and the August through October ’07 period is lower in most respects than the May through July period of ’07.
http://www.trulia.com/real_estate/San_Francisco-California/
Dude, you call that trend “coming down”?
Dude remains hopeful John.
Looks that way to me. But I’m looking at early ’07 numbers vs. October 07 numbers, not at the chart, which is ’00 through October. Obviously, compared to 2000, the only thing drastically down is # of sales.
That San Francisco Market Trends report (linked to above) is showing year-over-year prices sharply higher for everything except 1br.
Some one asked for 20 Year sales volume figures for SF.
Single Family
http://www.blackstone-sanfrancisco.com/198.html
Condos:
http://www.blackstone-sanfrancisco.com/199.html
Looks like volume is down from the 2005 peak.
“Is your explanation the only way you get to median prices increasing in a declining sales volume market? Or are there other possible scenarios.”
As I explained in my post, median prices increasing don’t tell us anything good or bad about “real” prices in a market of declining sales volume. We don’t know if “real” prices are going up, down, or sideways.
And they could be even doing all three at once, depending on the property, neighborhood, etc.
Economist,
Every time you post I wonder who you are talking to, and then I finally figure out you are talking to the author of the post (i.e. Adam/Socketsite).
Anyways, one quick question for you:
I don’t doubt that you have more knowledge on this subject then I, but when I think about what you are posting, I can’t reconcile a couple things, and maybe you can help me understand.
You say:
The quantity of houses sold = quantity demanded, AND
The quantity of houses sold = quantity supplied TOO.
But given that some homes don’t sell and are taken off the market, isn’t it innacurate to say that the quantity of houses sold is the quantity supplied? The quantity supplied would inherently be a larger number then the quanity sold, no?
And while I understand that sales volume is not Demand per se, if Demand is a measure of the desires of those with purchasing power at a set price, wouldn’t a decline in sales volume be at least be highly suggestive of a decrease in Demand? In other words is there any scenario under which demand would increase while sales volume declined?
From the wikipedia link:
“The law of demand is normally depicted as an inverse relation of quantity demanded and price: the higher the price of the product, the less the consumer will demand, cet. par. “Cet. par.” is added to isolate the effect of price. Everything else that could affect supply or demand except price is held constant. The respective relations are called the ‘supply curve’ and ‘demand curve’, or ‘supply’ and ‘demand’ for short.”
Wow, that Trulia site is pretty neat!
So for 2-BRs (what I was looking at), $/sq.ft. has actually risen a little bit compared to last year. But 1-brs are down 10%. Too bad I’m not shopping in that market.
And prices in the summer were SUBSTANTIALLY higher than they are now, although asking prices remain high, selling prices are down. (SF overall is down 10-15% since summer)
Average prices are about 10% higher than median which represents a skew towards higher-priced properties, which comes as no surprise.
Yes, and Pacific Heights is the top selling neighborhood which tells us something about the makeup of the median and average prices.
either buyers in S.F. have a ton of cash or jumbos are still easily available here. I think it’s some of both.
Wonder, that’s my point exactly! Mix should be actually lowering prices at this point given what’s happening in the jumbo market. And Missionite, I’m very well-versed on statistics, so I understand how medians work. The only report that I know of to really adjust for that is Case Schiller. According to their latest numbers, prices in the upper tier of houses are not declining…they’re actually up! And for the greater Bay Area, you have to acknowledge that SF is heavily weighted toward the upper tier of prices. Keep in mind that this report is for the same exact home over time, so it takes out any mix effect. Finally, sales in San Francisco proper were down 9% last month according to Data quick — not 36%. This was substantially stronger than the Bay Area as a whole, which has been the case for the last few months. I’m just pointing out facts, which suggest that we are NOT in the middle of any seriuos decline in SF home values. No, I don’t think things are all rosey either…. far from it. With that said, there doesn’t seem to be any bubble bursting either.
So with a clear demostation that the peak is actually May 2007, do we bounce around peak level prices, go lower, or go higher?
Marinite, thanks for your questions. Let’s see if I can answer them with out expending too many lines of text!
But given that some homes don’t sell and are taken off the market, isn’t it innacurate to say that the quantity of houses sold is the quantity supplied? The quantity supplied would inherently be a larger number then the quanity sold, no?
The quantity supplied is the same thing as the number of homes that clear in a market. If a house doesn’t sell, it’s because the seller is asking for a price above what the market is willing to pay. The fact that someone lists a home, then takes it off the market, doesn’t really matter from a definitional standpoint. It’s the same as the little old lady who won’t sell at any price. Some people are at the far right side of the supply curve: they will only sell at a really high price. If the market price is below that point, then they can’t sell. Similarly, there are people who will only buy when prices are really low– if the market price is higher, they’re shit of of luck.
In a perfectly competitive market, if there is unsold inventory, then it’s because the sellers are asking too much. The housing market generally always has unsold inventory, but that’s additionally because of other things about the market structure.
The wikiquote is a bit misleading because they’re talking about one person’s demand curve (micro), rather than the market (macro). Let me rephrase it in macro terms:
The law of demand is normally depicted as an inverse relation of quantity demanded and price: the higher the price of the product, the fewer consumers will buy it, ceteris paribus (all things being equal). Everything else that could affect supply or demand except price is held constant. The respective relations are called the ‘supply curve’ and ‘demand curve’, or ‘supply’ and ‘demand’ for short.
The important point here is that the demand curve will shift outward if society’s preference change toward the given product (that is, at any given price, more people want it– say because it’s suddenly cool to own, or necessary to produce a newfangled widget, or something). It will shift inward if people want less of it at any given price (say, for instance, no one can get sub-prime loans, or buying a house looks risky or uncool.)
This is represented on the graph by the *entire* demand line shifting outward or inward.
wouldn’t a decline in sales volume be at least be highly suggestive of a decrease in Demand?
Yes, in the short run. It does in the case of housing, because when people sell their homes they often *need* to sell their homes (they can’t wait to take a new job). And housing prices are generally sticky, because people are reluctant to lower their asking price. You can see this all over the news– people don’t want to ask for less.
In the long run, however, lower volume might also indicate a reduction of supply– say if a new environmental regulation made it really expensive to build new units. Then the supply curve shifts inward (for any given price, builders will build fewer units because of the higher enviro costs).
My point with my earlier post was mainly semantic.
In other words is there any scenario under which demand would increase while sales volume declined?
If supply is held constant, generally no. But you can get situations where the supply curve shifts inward dramatically, and the demand curve shifts outward (increases) only a little. Depending on the slopes of the lines, the quantity trading hands (the number both sold and bought = sales volume) will decrease in spite of the rise in demand. (the market price would jump too.)
If you are interested, I suggest just drawing out the graphs from the wikipedia article, understanding what P, Q, and the curves stand for, then shifting the curves around and see what happens. What happens to price and quantity if demand shifts outward and supply stays the same? If supply increases (shifts outward) and demand stays the same? If they both increase or decrease?
I hope this was clear. good luck!
Sorry, that post should be addressed to Missionite. I was just on the Marin Housing Bubble blog!
Missionite/economist,
good posts, both of you.
I agree, little can be extrapolated from short term trend data. There are bullish and bearish cases for SF proper RE.
I’m bearish mainly because I watched this exact same process happen in San Diego in 2003-2005, and have followed it through today.
A turn in RE takes YEARS (not months) to occur. it is not until far after the fact that the trend is obvious.
watching a downturn is like watching grass paint grow as it dries
we will know for sure if there is a SF downturn about 2 years after it happens.
Example: look how long it took economists/reporters/officials to admit there was a RE problem, then how long they talked about “soft landings” like a souffle, until they finally admitted there was a bubble in many markets, and that it was popping in many markets.
Good stuff missionite and economist. I agree that the pricing data we have do not lead inexorably to a conclusion one way or the other on the direction of the trend. And I have to admit that SF held out about a year longer than I expected before we started to see pretty compelling evidence of a downturn. But I’m with ex-SFer — strong markets in San Diego, L.A., and Orange County (all pretty desirable places where it was not obvious that a bubble had formed) are all about 12-18 months further along in the cycle than SF, but the significant downturn there is now obvious (it wasn’t so obvious only about a year ago). SF’s pattern is very similar to what happened there — first outlying areas fell then it worked its way inward toward more expensive regions.
One might have plausibly argued a year ago that “SF is different” (no more land, Google money, etc. — all the familiar arguments) but I don;t think that could make us immune any longer. The mortgage mess has really exploded. Loose lending standards are now gone. Lots of SF residents have lots of money, but SF buyers relied on these funny loans far more than the national or statewide averages, so its hard to argue that the SF buyer market didn’t need such loans to prop up prices. But the biggest factor is that we’re now pretty clearly heading into a recession, or at least a slowdown. People (even the well-off) do not dive into big, risky purchases during a slowdown.
Closing stats on the big developments coming on-line in the Spring (ORH) will be a significant bellwether. If just about everything ends up closing at the contract prices set during the heady days, that will be some pretty good evidence of market strength. If not, it will be good evidence to the contrary.
All I can say is that in going to a bunch of open houses, closings on new developments such as the new South Park condos and those along Berry Street have been surprisingly strong.
And I’m not talking about putting down deposits, I’m talking about people closing deals and actually moving in during Sep/Oct/Nov, supposedly a very troubling time.
Economist,
Thank you, I found that very helpful. It’s posts like that that keep me addicted to this site.
Lance,
In your original post you said “And as I said last month, mix works both ways. Given the lack of availability of non-comforming loans, you would expect mix to actually have negatively impacted these numbers.”
As I demonstrated, this is simply not so. A sudden drop in sales volume on the lower tier can tilt the median upwards, even if both volume and all prices drop across the board.
But if you read my post a little more carefully, you would note that I also said that prices in the upper SF tier (such as Pacific Heights, which not coincedentally is the #1 selling neighborhood right now) were still strong and appreciating.
So I’m not really sure where you are disagreeing with me now.
SIDE NOTE TO ALL:
Those of you that are signing on as “anon”, can you at least come up with a tiny bit of creativity: make up a name and stick to it. Even something simple like anon1, anon2, etc.
Just using “anon” makes it impossible to tell who is talking, and makes it difficult to respond to just one of the “anons”.
It’s not that hard guys. C’mon!
I have been checking in with this blog for about 3 months. It is interesting to observe the drift of the dominant view here from one of “definite, radical price declines in the near offing” to a more agnostic, nuanced view of “be patient,” “just you wait til Spring,” etc.
What happened in LA or San Diego counties a year ago is no more relevant to the SF market than the current market effects in Manhattan.
I sympathize with the patient stance of the would-be SF buyers who are waiting for the right moment. I really do. I too waited for years (1995-2002) to see a substantial price decline in SF homes.
But beware. The really smart move for would-be buyers on this site is to convince other would-be buyers NOT to buy now by arguing that prices are coming down (against all observable data). That decreases competition and reduces the cost for the tricky would-be buyer would would say one thing, and do another. In gaming theory, this is the classic ‘prisoner’s dilemma’ scenario.
Is it happening on this blog???
August rate locks for November purchases is not a reality. Lenders in this market have no problem reneging on promised rates. Many of these programs no longer exist, at all. Can we dispense with the “artificially inflated because of earlier rate locks” argument?
No. Nowadays it’s 10% down or hit the highway.
Oh, and it has been that way SINCE August 10th or so. Rates have come down twice. It isn’t about rate locks. It’s about programs that don’t even exist. Ten to 20 % down, or forget it.
And hats off to fluj who publicly predicted here weeks ago that the October sales numbers would substantially improve on September’s. 😉
Yep, fluj had it right on the October volume. Any thoughts on November? 2006 saw 227 homes and 237 condos/TICs (about the same as October ’06). November numbers may answer Adam’s question of whether the mortgage meltdown in August delayed and pushed September closings into October or if sales activity really is picking up.
sanfrantim – The Prisoner’s dilemma only applies in a game with very few players. Most examples play the game with just two players.
The SF real estate market has thousands of players. Taking the Prisoner’s dilemma “defection” strategy on SocketSite is meaningless. And that assumes that 100% of SF buyers and sellers read this site.
Sure, excessively bearish predictions probably have some tiny marginal influence on the market. You could say the same about the bullish predictions. Anyone with a stake in the market who thinks that they can steer good deals their way by posting here are fooling themselves.
I am not assuming that every SF buyer/seller visits this site. But it is wrong to dismiss the impact of a defection strategy based on less than 100% market participation.
Of course, the influence that the “players” on this site may have on the SF housing market overall may be on the margins. That doesn’t mean the game is not worth playing, does it?
I do not know how many readers check this site regularly. Let’s say that is 1000 readers (realistic? Editors?). If only 100 readers are would-be buyers and half of them are influenced by the bearish comments here to put off making offers on property, that definitely could impact market activity.
Let’s face it: Would-be buyers are in competition with other buyers, not sellers. A Buyer’s self-interest is served by trying to convince other would-be buyers that the market is too risky. Is there any disagreement with that? All I am saying is that those in the market who visit this site for advice should take into consideration the hidden self interest of those who may be posting.
Sanfrantim, I can vouch for the fact that most everybody on here is pretty skeptical. And rightly so.
As for November sales, I think they ought to be decent. It seemed like activity was fairly brisk in October. November ’07 will probably be down from 11/06 but comparable to October ’07. We have hit a slowdown now, tho. December numbers aren’t going to be too hot.
I miss your point, fluj. “Pretty skeptical” about what? about the market? about the motives of other posters?
I take it that you do not disagree that would-be buyers serve their interests by trying to convince other would-be buyers to stay on the sidelines.
About the motives of other posters.
I take your point, sanfrantim. Maybe some people do become convinced to sit out by a blog such as this one. But that number is dwarfed by traditional media.
Look at today’s Chronicle article, entitled Bay Area Housing Market Misery : http://www.sfgate.com/cgi-bin/article.cgi?f=/c/a/2007/11/16/BUH8TCG24.DTL
Nine stanzas down is where they get into the sunnier news. They qualify it, as they should, because of median versus volume, foreclosures, etc. But you know what I mean.
Sanfrantim — some that post here may be looking to buy, some looking to sell, and some who make their living in this industry, and that certainly might impact their points of view. But I don’t think anyone seriously is thinking that he/she can affect the market by posting something here.
You should look back about 7-8 months on this site. If anyone even suggested that market indicators were trending downward, you were roundly shouted down, laughed, and mocked. Of course prices were only going to be 10-20% higher in Spring 2008 than in Spring 2007. Then in early summer the split was about 50-50 as more data kept rolling in. Now you see that the overall (but not uniform) consensus is that there is no way SF prices are climbing and they’re likely to fall, perhaps considerably, over the next few years.
It’s been an interesting read. I think there are enough participants with real knowledge and insight to call B.S. and keep the discussion pretty thoughtful and honest.
Trip, I am not so quick as you to want to dismiss the influence of a site like this on real decisions by buyers and sellers. Isn’t that the whole point of this site – to give “tips” and assess “trends”??? (See the top of this page).
I think we post here because we hope to have some influence. If not, then why bother at all??
I appreciate your longer view of this site’s editorial direction. As I said, I have only been visiting here for about 3 months. Since I’ve been visiting, the ‘bearish’ point of view has dominated.
And, Trip, don’t get me wrong, I enjoy visiting here. It is a curious mix of information and entertainment. I do not have your faith that the combined “knowledge” here ultimately weeds out the “BS”, but it is fun nonetheless.
Hey Sanfrantim, what do you do for a living?
I am a trial lawyer specializing in intellectual property cases. And you, Foolio?
sanfrantim – I guess I worded my comment too vaguely. I did not mean to imply that 100% of SF buyers and sellers need to read this site in order to dismiss the Prisoner’s dilemma notion of seeding ideas that diminish competition. In fact I meant just the opposite.
What I meant was that the Prisoner’s dilemma notion does not apply at all. Even if all buyers and sellers read every post, it still would not apply. The fact that Socketsite reaches a subset of buyers and sellers further diminishes the influence of the defection strategy.
As to why people post ? Perhaps not everyone is trying to manipulate opinion and steer rivers of prosperity their way. Perhaps some simply want to share their knowledge and insight.
Mr. Milkshake, I agree that “not everyone” is trying to manipulate opinion towards their self interest; only some are. That is uncontrovertible.
sanfrantim, maybe the opinions that people express here are reflective of the general sentiment of the market, and not a thinly-veiled attempt at manipulation? As fluj points out, negative news about real estate in general is abundant and not limited to SocketSite.
When the market was still in boom mode, the papers and blogs regularly featured pieces on “new record prices.” Isn’t it fair, now that the cycle is shifting, to also feature the “new record foreclosures” articles? The potential buyers out there who have never even heard of SocketSite will still see this stuff on the evening news anyway.
Don’t get me wrong dude; this site, or any other, is entitled to its editorial point of view. I just want people to be smart about the opinions they are getting. Unlike the evening news, Socketsite draws readers who are especially interested in real estate advice and so arguably is a more important source of information to the select population searching for homes. I wouldn’t dismiss SS’s significance.
And for those of you who are wondering, SocketSite currently averages over 25,000 unique visits a day (including readers who plug in via an RSS feed). Actual unique visitors (as opposed to visits) directly to the site currently averages over 5,000 and is closing in on 10,000 (again, per day). And according to our last survey, 76% of our readers consider themselves to be in the market for a property (in some way, shape, or form).
Our goal is to provide buy-side analysis (free of the typical rhetoric), the inside scoop (especially on new developments and interesting listings), and food for thought (be it in terms of market trends, architecture/design, or neighborhoods). Our goal is not to move the market in one direction or another (but rather to help our readers understand the direction in which it is moving).
And for the most part (with a few notable exceptions), we believe the same goes for our readers who comment as well (which currently constitutes less than 1% of our overall visitors). And yes, we do our best to moderate out those who are obviously trying to game the system by using multiple aliases to post multiple positive/negative comments about a property in specific (or the market in general).
Regardless, it’s good food for thought. And as always, thank you for plugging in.
san fran tim,
you bring up good points, but I have to agree with others… there is a somewhat bearish slant to socketsite now compared to when I started posting here, but there’s a pretty bearish sentiment on RE across the nation.
I agree with you that the bearish sentiment can affect others in the marketplace, but I’m not sure that this matters.
let’s pretend that I’m looking to buy a home for $1M. Everything I like is at $1.5M. I can talk the market down to $1M, but in the end that doesn’t negate my comments, as I’m CURRENTLY SITTING OUT until the price falls to $1M.
thus, I may be talking my book… but my book and pocket are aligned. I’d rather listen to people who have skin in the game anyway!
Likewise, this trick works both ways. Homeowners often play up how much their own personal property or neighborhood will increase (or at least hold value).
FWIW: Although it is not my goal to influence “the market” it IS my goal to influence the market participants… I want people to understand what they’re getting into when they sign on the dotted line.
But I know what SF is worth to ME now, and thus I highly doubt that me talking my book will ever bring prices to levels that I would find acceptable… it would require a near 40% reduction in prices… not gonna happen!
Sanfrantim–
ABD in Poli Sci here. Just interested in your Game Theory background.
The funny thing is, when I was reading Trip’s comment, I was like “this has to be Trip”…and scrolled down. Guess what, it was Trip.
Of course, occasionally, I read a post and say “this has to be fluj”, and it is.
sanfrantim
Your theory doesn’t work – if I want to buy, and am able to talk the market down to buy, it is not good for me because the market is down!
For example, if I want to spend 1M but everything I like is 1.5M (use Dude’s example), I may be able to talk the market down to 1M. However, the danger is after I buy at 1M, the market will continue to go down so the house may be worth only 800K.
This is not stock market.
John – If sanfrantim were right then the strategy might work. Just as many believe that we’re due for a downward correction, an overcorrection downwards would bounce back. If talking the market down brought it below its real value then it would revert to the norm in time.
No, I don’t think that talking the market down or up on the internet is going to directly affect any individual. Learning about the market’s nature however will.
Kudos to the Socketsite editors and those here bringing lucid explanations of a complex situation. I’m learning a lot.