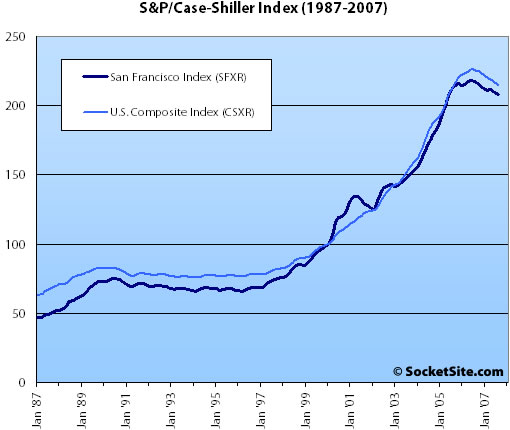
According to the August 2007 S&P/Case-Shiller Home Price Index (pdf), single-family home prices in the San Francisco MSA slipped 4.2% year-over-year and fell 0.2% from July ’07 to August ’07. For the broader 10-City composite (CSXR), year-over-year price growth is down 4.9% (down 0.7% from May).
The standard SocketSite S&P/Case-Shiller footnote: The HPI only tracks single-family homes (not condominiums which represent half the transactions in San Francisco), is imperfect in factoring out changes in property values due to improvements versus actual market appreciation (although they try their best), and includes San Francisco, San Mateo, Marin, Contra Costa, and Alameda in the “San Francisco” index (i.e., the greater MSA).
∙ Further Weakening in Home Prices According to the S&P/Case-Shiller® HPI (pdf) [S&P]
∙ July S&P/Case-Shiller Index: San Francisco MSA Continues Decline [SocketSite]
correct me if I am wrong, but wouldn’t the lack of ‘perfection’ in factor out changes in property values cause the Case Schiller Index to skew better?
Also, I understand the footnote about it only tracking Single Family Homes (and isn’t it Existing Single Family Homes). However, don’t these represent the ‘stickiest’ of all home prices, the ones least likely to decline?
It is my understanding that Condo’s and new construction are more sensitive to a downturn.
If you use the Dataquick numbers on sales and median price to come up with a model that leads to the Case-Shiller results here, one example is:
Alameda and Contra Costa down 8%, San Mateao flat, S.F. up 6% and Marin up 6%= SF MSA down 4%.
This happens because Alameda and Contra Costa make up over 75% of the transactions tracked in Case-Shiller’s S.F. MSA, so even when you factor in the higher median price in S.F., Marin and San Mateo the math roughly works. I don’t mean to suggest that this is actually hapenning, just to point out that it is reasonable for S.F. (and Marin) to show price appreciation even in the face of the Case-Shiller numbers.
I think we would need to see at least 20% declines in the CS SF MSA before we can be certain that S.F. SFH’s are losing value.
The addition of other counties can skew this. However, so many people spent so much money on homes (remodeling, etc.) that values should have gone up, i.e. the real decline is greater. Plus, add in inflation (2-3% depending on which numbers you buy) and the carrying cost of a loan (5-7%, 4-6% after taxes), maintenace, property taxes, HOA if a condo and housing is a pretty bad investment this past year.
Happily continuing to rent and investing the savings in commodoties (oil, precious metals).
Anono, I couldn’t agree more. For example, I have a condo in Miami, Florida. Now MY condo never goes down, so when Case-Shiller goes down in Miami by 15%, I just figure that my complex is UP by 30% and the rest of Florida is down by 15.001%.
Because that’s what I believe and then when I do the math, the numbers make perfect sense!
tipster,
I actually have to agree somewhat with anono as Marin and San Francisco are doing some heavy lifting to keep the BA CSI from falling more than .2%. But that 20% is a bit over the top. I mean, we are talking scorched earth (literally, it is hot, and metaphorically) out in the hinterlands of CC and Alameda counties. BTW, Miami has been my favorite index to watch; they went up the highest and were the last to turn the corner. They now appear to be in free fall. Let us all be thankful we have nothing to do with condos in Miami (even if the Beacon pool scene on a hot day resembles… hey, this is Ess Eff, shouldn’t that be a hot tub scene — or is that only in Marin?)
All of this is a little apples-and-oranges, but the DQ numbers for YOY August ’07 – August ’06 don’t seem to support any conclusion that SF is “really” doing better than the August-August CSI numbers would indicate.
DQ (http://www.dqnews.com/RRBay0907.shtm) data for San Francisco, San Mateo, Marin, Contra Costa, and Alameda counties show the median for every one of these counties was up YOY (except CC — flat). Again, I just don’t think the numbers can reasonably lead one to conclude that the market trend in SF is appreciably different from that in the surrounding counties. There is certainly nothing indicating that CSI needs to show a 20% decline in the SF MSA to conclude there is any decline at all in SF proper. If any conclusion can be drawn, it is that SF is no different from the immediately neighboring counties in price trends.
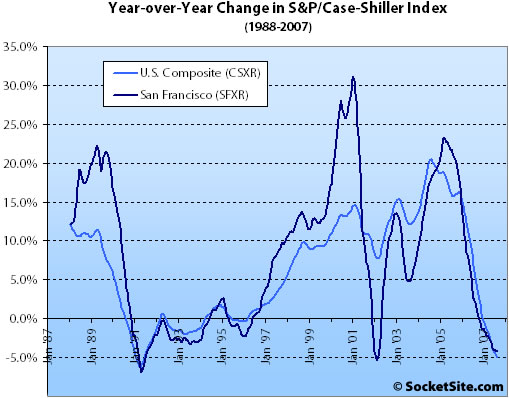
These graphs look pretty dramatic. However, if these are plotting the rates of change, or appreciation, 03/02 is at 13%, 04/03 at 10%, 05/04 at 20%, 06/05 at 8% and flat for 07/06. I’m not sure if I’m looking at this correctly, but the overall appreciation from 2002 through 2007 is 61% and with a 5% decline, that brings the overall appreciation to 53%. There might be some market corrections, but after so much appreciation, it is expected due to any expansion reaching a point of retraction due to its cyclical nature, but the overall trend line is very positive. Boils down to things are still pretty expensive and I would not hold my breath for a market collapse.
Trip wrote: “Again, I just don’t think the numbers can reasonably lead one to conclude that the market trend in SF is appreciably different from that in the surrounding counties.”
The DQ link in Trip’s post says that YOY, the median price went up 7.8% in San Francisco, while there was no median price change YOY in Contra Costa. Isn’t a 7.8% annual increase “appreciably different” from 0.0%?
Dan, you would have a valid point if CSI numbers included only SF and CC counties. But it includes all the surrounding counties (e.g. Marin median was up 12.2%). And it makes other adjustments that correct for changes in medians that might not reflect apples-to-apples comparisons (one can certainly poke at its methodology, but it is very influential in the markets and the consensus appears to be that its methodology is pretty sound). Nobody has ever shown me anything convincing at all to indicate that SF is all that different from the SF MSA as a whole.
I’ll say again what I’ve said before: Case-Shiller could show us the data inside the SF MSA and we would know for a fact whether SF is different than Oakland, Pittsburg, Richmond, Fremont, San Leandro, Pleasant Hill etc… I’m not questioning the methodology, I am guessing at what the numbers may show if you broke them down by county.
The small portion of the MSA from S.F. and the obvious price declines in Alameda and Contra Costa lead me to conclude that it is reasonable to expect a difference. Some cities in the bay area are proactively lowering property tax assessed values for next year due to clear accross the board price declines in those communities.
Of course, there is no real way to present any hard data to convince Trip other than the data that S&P collects for the index.
With the Fed aggressively cutting rates for the next 12 months, is the market going to just continue going higher in places like SF and Marin, where no rate cut was needed in the first place?
I agree that the best way to end this debate would be to see the breakdown in CSI’s data. However, given the fact that the SF MSA price trends have very closely tracked those of the U.S. as a whole, it is a pretty wild hypothesis to suggest that SF is nevertheless now disconnected from its own MSA with respect to current market trends. I’ve never seen anything to support such a suggestion, and it is pretty far-fetched on its face.
Really? With 2nd and 3rd quarters of US GDP at +3.8% and +3.9% and solid jobs numbers (ADP reported +100k this morning) can we really expect the Fed to keep cutting?
I guess we will know better later today but, as of this morning, the market consensus seems to be a 1/4 point cut (with a small minority say no cut at all) and then the Fed holding.
For those who wanted the HPI broken out by county here you go. Be warned, some of you will not like it.
*yes it’s a blog, but who else is going to graph this data?*
http://housingbubblebust.com/OFHEO/Major/NorCal.html
[Editor’s Note: Do keep in mind that OFHEO data is based on conforming loan data for single-family homes, and that “San Francisco” includes San Francisco, San Mateo and Marin counties (down 0.86% YOY) while “Oakland” includes Alameda and Contra Costa counties (down 3.28% YOY).]
Looks like SF is pretty steady compared to the rest of the area, BDB.
With all the caveats about limitations re OFHEO data, this is yet another data point that indicates SF (I know — not just SF, but with Marin and San Mateo counties) has followed the up-and-down trends of all of Northern California at least since 1975. One can poke holes in CSI’s methodology, but I still see no basis for distinguishing SF from the SF MSA that the CSI uses.
Editors – thanks for the note, sorry I didn’t really call that out.
Craig, I can see how you can take that away from the last few data points.
Although, to me, it shows that rises and falls in SF prices essentially track with the rest of the Bay Area when looked at over the long term.
So, this debate over the CSI, whether SF county might be some kind of exception but that fact is hidden by the poorer performing areas, would seem to be disproved.
While the outlying areas are clearing feeling the drop sooner, based on the historic data, we can expect to see similar drops in SF county itself.
The only thing that appears to be of debate is the extent of the drop SF will see.
Seeing that the HPI appears to want to return to price levels supported by inflation, this idea supported by the fact the home prices historically track with inflation and wage growth, it appears we are in for one for one heck of correction.
I think the saving grace here might be that fact that in 1990(?) the US Government altered how inflation was calculated so what appears as 4% inflation today would be 10% inflation if the same formula from the 1980’s was used. So inflation, as we tend to think of it, may be running higher then it is currently reported thus quickening the correction a bit.
However, I must admit, that I find that explanation of current inflation a little ‘black helicopter’ish.