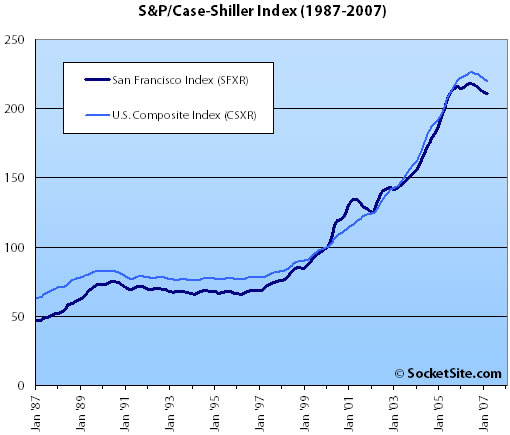
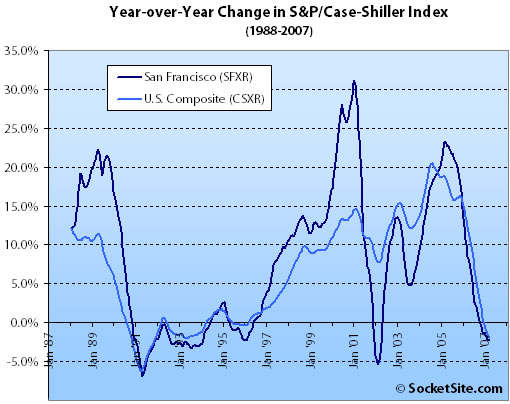
According to the March 2007 S&P/Case-Shiller index (pdf), single-family home prices in the San Francisco MSA slipped 2.3% year-over-year but gained 0.1% from February ’07 to March ’07 (the first monthly uptick since May 2006). For the broader 10-City composite (CSXR), year-over-year price growth is down 1.9% and down 0.4% from February.
As previously noted: The S&P/Case-Shiller index only tracks single-family homes (not condominiums which represent half the transactions in San Francisco), is imperfect in factoring out changes in property values due to improvements versus actual market appreciation (although they try their best), and includes San Francisco, San Mateo, Marin, Contra Costa, and Alameda in the “San Francisco” index (i.e., the greater MSA).
∙ Spring Brings No Signs of Warming in Home Prices [standardandpoors.com]
∙ February S&P/Case-Shiller Index Decline Continues For SF MSA [SocketSite]
My back of the napkin analysis based on the numbers here: http://www.dqnews.com/ZIPSFC.shtm (thanks boom for the link)
For San Francisco it looks like areas that are going up in median value are showing significant decreases in sales volume, and areas that are going down in median value are showing substantial increases in sales volume. The spread between the two in terms of sales volume is a pretty substantial 50%. Overall rate of increase YOY is a rather anemic 3% which probably falls within the MOE given the unknowns about improvements.
What that says to me is if real estate agents want to make those sales commissions they better start counseling their clients to lower their prices, or there are going to be a lot less sales overall.
wow, from +11.5% nationally to -1.4% in 12 months, housing hit the brakes so hard it’s like economic whiplash.
http://www.smartmoney.com/bn/ON/index.cfm?story=ON-20070529-000567-1326&hpadref=1
‘U.S. home prices dropped 1.4% in the first quarter compared with a year earlier, the first year-over-year decline in national home prices since 1991, according to the S&P/Case-Shiller index released Tuesday. A year ago, home prices were rising at an 11.5% pace. Prices have been falling for the past three quarters.’
First, the San Francisco MSA is comprised of the cities of “San Francisco, Oakland, Fremont, Hayward, Berkeley, San Mateo, San Leandro, Redwood City, Pleasanton, Walnut Creek, South San Francisco, San Rafael” (see http://www.whitehouse.gov/omb/bulletins/fy2007/b07-01.pdf )
The numbers reported can only be used to compare area-wide trends which are pretty meaningless to individual buyers in our market — San Francisco buyers are, generally, not at all interested in the other cities and vice versa.
According to the San Francisco MLS, in March 2006 there were 217 single family homes sold in San Francisco at an average price of $1,133,110. In March 2007 the numbers were 200 sales with an average price $1,249,800. So the number of sales was down by about 8% but the average sales price was up more than a 10% (compared to the S&P/Case-Shiller number of -2.3%).
If you break it down even finer the average sales price of a 2bd/1ba home in SF declined 0.8% (March ’06 to March ’07) while 3bd/2ba homes increased 1.6%