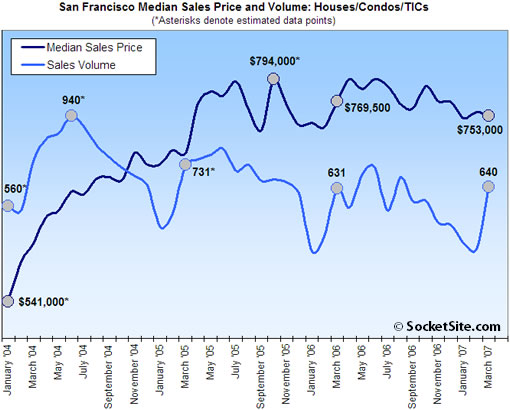
According to DataQuick, the median sales price for existing homes in San Francisco was $753,000 last month, down 2.1% compared to a revised March ’06 ($769,500), and down slightly (0.6%) compared to the month prior. Sales volume, however, was up slightly (1.4%) year-over-year (640 sales in March ’07 versus a revised 631 sales in March ’06) and was up sharply (70.7%) compared to the month prior (375 recorded sales in February ‘07). Sales volume typically builds through the first six months of the year.
For the greater Bay Area, the recorded median sales price in March was $639,000 (a revised year-over-year increase of 2.1%) and sales volume was 8,317 (down 19.6% from a revised 10,343 sales in March ’06). At the extremes, Napa recorded a 9.2% reduction in median sales price year-over-year, while Alameda recorded a 3.1% year-over-year gain. And year-over-year sales volume was off over 30% in both Contra Costa (31.2%) and Solano (36.4%) counties.
As noted last month, we’ve adjusted our graph to reflect DataQuick’s change in methodology. Data points marked with an asterisk (*) reflect our estimate of what DataQuick will/would report for revised sales volumes/prices.
∙ Bay Area home prices up, sales still slow [DQNews]
∙ San Francisco Home Sales Down, Median Sales Price Up [SocketSite]
It would be nice to see these graphs for Jan 2007 through Dec 2007 with 2006 data overlapping in a different color. I keep looking back to compare months and its hard to see how its trending off prior year.
eddy
ps: i just looked outside and the sky is still there, yet prices in SF declined ~2.1% YoY. 🙂
pps: I’d be a hypocrite if I didn’t go on record that I have no confidence in the dataquick #’s as a proxy for market reality.
Well the sky is still there because it didn’t happen. I was told that prices never go down, so they must not have done so… 🙂
Is this the ‘crash’ everybody has been waiting for? Hilarious.
I don’t mean to get personal but posts like ‘wondering’s are what people should find hilarious. It’s like they have never looked at a chart of prices prior to 1995. The last bust, ’89/’90, took 5 years to bottom out.
Let’s look at some recent events –
NAR EXPECTATIONS GOES NEGATIVE
“The National Association of Realtors said Wednesday it expects its measure of [U.S.] home prices to fall this year for the first time since the group began keeping track nearly 40 years ago. In its latest monthly forecast, the real estate group said it expects a 0.7 percent decline in the median price of an existing home sold in 2007. A month ago it had been projecting a 1.2 percent increase.”
http://money.cnn.com/2007/04/11/news/economy/home_prices/index.htm
CASE-SHILLER INDEX GOES NEGATIVE
“January in San Diego, down 1.7%, or a 22.4% annual rate. Prices dropped 1.1% in Los Angeles, or a 14% annual rate … San Francisco is down 1.4% (annual rate of approx 17%).”
http://homes.wsj.com/buysell/markettrends/20070328-nutting.html
SO CAL SEES A DROP OFF OF ENTRY LEVEL SALES
“Sales remained at a ten-year low while the median sales price increased to a new peak. The rise in median is in part due to a drop-off in sales of entry-level homes, a real estate information service reported.”
http://dqnews.com/RRSCA0407.shtm
MONTHLY PAYMENTS 16% ABOVE LAST PEAK
“The typical monthly mortgage payment that Bay Area buyers committed themselves to paying was $2,944 last month, up from $2,884 the previous month and down from $2,977 a year ago. Adjusted for inflation, current payments are 16.0 percent above typical payments in the spring of 1989, the peak of the prior real estate cycle. They are 8.6 percent below the current cycle’s peak last June.”
http://dqnews.com/RRBay0407.shtm
NEW HOME SALES CONTINUE TO DECLINE
“D. R. Horton, The second-largest US home builder, reported a 37% y-o-y decline in net new orders, with all six regions showing negative comparisons. Orders fell in the Northeast (21%), Southeast (-30%), South Central (-34%), Southwest (-39%), California (-59%), and the West (-28%).”
http://seekingalpha.com/article/31929
HOUSING SLUMP PINCHES STATES IN POCKETBOOK
“State tax revenues around the country are growing far more slowly this year and in some cases falling below projections, a result of the housing market slowdown that has curbed voracious spending on real estate, building materials, furniture and other items. In California, where income tax receipts in January were $1 billion less than forecast, a nonpartisan legislative analyst has urged budget cuts and warned that the state could have about $2 billion less in revenue this year and next than Gov. Arnold Schwarzenegger has projected.”
http://www.nytimes.com/2007/04/08/us/08housing.html?_r=1&oref=slogin
These are just a handfull of the latest market indicators that all show housing declining, even in San Francisco, for the foreseeable future.
This isn’t ‘hilarious’ it is lost homes, lost jobs, lost tax revenue to fund local and state services, etc.
after reading lots of RE blogs for the past year I’m convinced that real estate has become one of those issues like abortion, gay marriage, global warming, etc. It has really become impossible to discuss in a constructive way with someone who closely holds a contrary opinion. Any science or statistics that contradict the other person’s opinion are just dismissed.
I S, you are right. It’s emotional for many people. It’s emotional for those who own now, especially if you recently bought. It’s emotional for agents and brokers because the drop in volume has dried up some livelihoods. People who are committed to the boom will discount a slight drop as meaningless. People committed to the bust will cheer any bad news.
The fact is, we’ve had an unbelievable run up. Liquidity is tightening, buyers are more cautious, volume is declining, inventory is building slightly, and median prices are doing pretty much nothing. Real estate never tanks like the stock market. It’s far too illiquid, so declines are slow and painful.
Most indicators for at least the last 12-18 months say that we are in a decline now. This is a fact. But it’s quite possible that the definition of a decline means prices will just stagnate for the next ten or fifteen years. We may get a drop or we may get 10 years of 3% gains, right in line with inflation. This is pretty much normal. The 20% YOY gains we had before was not normal and it’s gone forever.
For the person who poopoo-ed the 2% drop as nothing special, I’d like to remind you that most people today don’t put more than 5% down on a place in the Bay Area. A 2% drop in one year nearly wipes out any equity you had if you bought 12 months ago. For the person who bought ten years ago, who cares? But that guy doesn’t pay attention to these stats anyway…
It would be nice if you created your graphs with the value zero at the bottom of the y axis–as done here, for example, the increase in median price from 541k to 794k visually appears like a much larger gain than it was. (Which isn’t to say it wasn’t a big gain!)
(More generally, a log graph would make the percentage changes more apparent, which is more useful as far as understanding the data, but that may be too much to ask…)
displayofquantitativeinformation: genius.