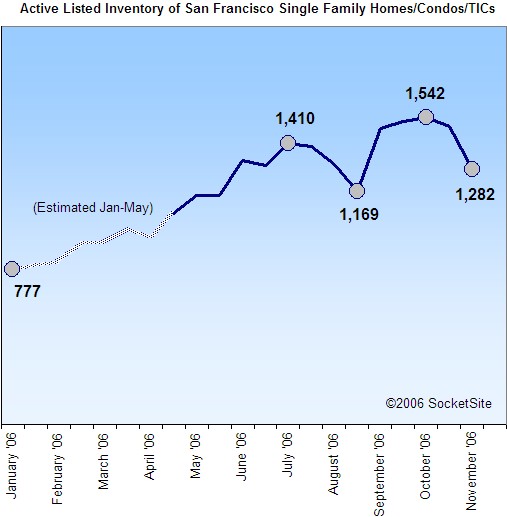
After peaking at ~1,600 active listings in the third week of October, the inventory of Active listed single family homes, condos, and TICs in San Francisco has declined about 19% over the past month (now ~1,300). A pronounced pre-Thanksgiving slowdown in new listings, the seasonal withdrawal of “un-motivated” sellers, and relatively strong sales have all contributed to the decline.
And while the absolute number of “reduced” Active listings in San Francisco (370) fell about 10% over the past month, it hit a new peak in terms of the percentage of overall active listings (28.9%).
∙ SocketSite’s San Francisco Inventory Update: 10/30/06 [SocketSite]

“A pronounced pre-Thanksgiving slowdown in new listings, the seasonal withdrawal of “un-motivated” sellers, and relatively strong sales have all contributed to the decline.”
The “un-motivated” sellers are a big part of this, I think. The ones with absurd wishing prices are pulling out to wait until spring, when some magical rebound of the RE market is supposed to occur. We’ll see if it happens. Will be a rude awakening for lots of people if they sudddenly become motivated for whatever reason, and prices in March ’07 are down from November ’06.
While the inventory decline isn’t the sign of a robust market, it’s obviously not the sign of a grossly deflating bubble, either. In other words, the SF market is….muted, pretty much as might be expected.
Did anyone else notice that Data Quick revised there September Sales numbers and that most of the areas the sales numbers were down, although this did seem to improve the median for many counties, except SF (+3.5 to +3.24) and Marin (+1.4% to -1.24).
Alameda was 1624 now 1418
Contra Costa was 1720 now 1442
Marin was 273 now 236
Napa was 124 now 114
San Francisco was 520 now 493
etc
here the DQ link
http://www.dqnews.com/ZIPCAR.shtm
Sorry to get a bit off topic, but…I’ve charted Dataquick numbers at times for my real estate business and noticed their numbers are not consistent – like the year ago sales number/price in the current press release does not match their press release from that month a year ago. I think Patrick.net or Charles Hugh Smith wrote in their blogs about these inconsistencies (but I can’t find that entry now). Does anyone know if these revisions are common and if so, do they generally favor a bias one way (like report high figures in the initial report and revise downward so later release look more rosy)?
I’ve heard that sometimes these numbers get revised because of transactions that closed during the month but weren’t originally included (delayed for whatever reason), so basically an unbiased update. This is driven by administrative timing and not slanting data. Not sure if it’s accurate, but it’s what I’ve heard.