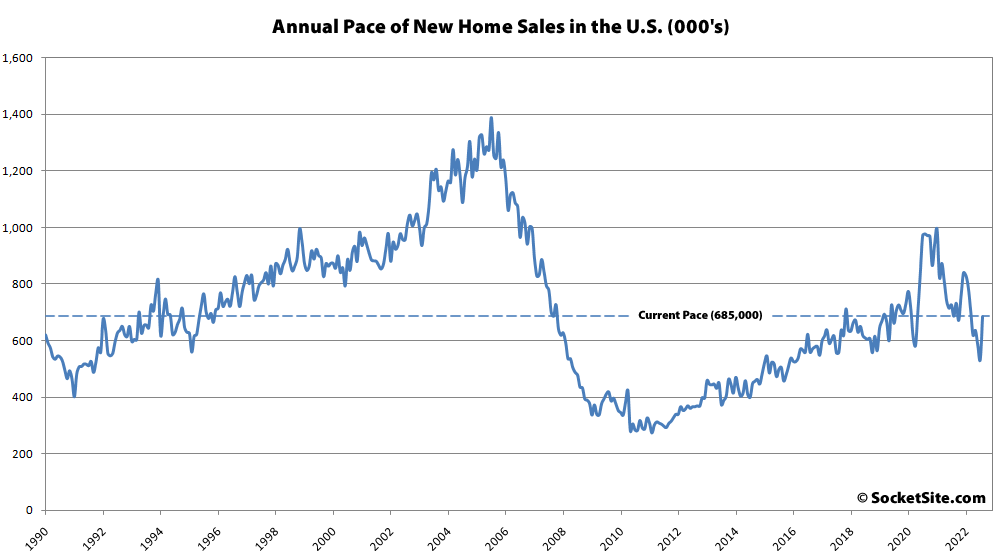
While the seasonally adjusted pace of new single-family home sales in the U.S. rebounded in August to an annualized pace that was effectively even with the same time last year, but still below pre-pandemic levels, the number of mortgage loan applications for new homes in the U.S. dropped 7 percent in September and was down around 13 percent on a year-over-year basis, according to data from the Mortgage Bankers Association.
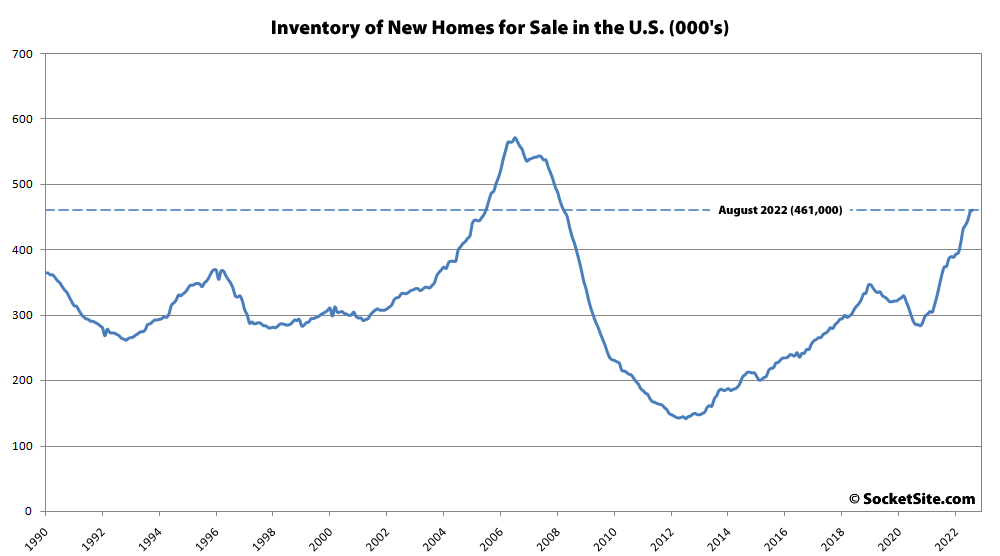
At the same time, the number of new homes on the market has surpassed a 14-year high, with 23.3 percent more inventory/supply than at the same time last year and the average price of the of the homes which sold last month having dropped over 6 percent.


There’s no telling how this will resolve. It is the correct terminology to say “demand” has dropped when doing an analysis like this, but in reality there is plenty of demand for housing. Just few people who can afford it at the current interest rates. If interest rates were lower however the prices would further inflate also ensuring no one can afford it. If you haven’t already established your wealth we’re in a lose lose economy right now…
I’m no expert in housing or real estate but did take economics in college (lol)…
If there’s no demand at the current price, but there’s demand at a lower price, this sounds like the market is not in equilibrium. This can happen because of a market inefficiency (like a monopoly, which I don’t think exists in housing), or simply because not enough time has passed.
So it sounds like prices just need to come down and that they will.
The slow-roll permitting and NIMBY restrictions have a constriction effect on supply. Demand is artificially supported by low interest rates. Otherwise there is not support for the current price levels. There isn’t enough productivity in the system – if there was then there wouldn’t be any or not as much need to cook the federal reserve balance sheet.
The “search for yield” against cheap debt concentrates capital flows to specific destinations/industries/financial methods that promise ‘quick/easy/profitable’ outcomes – and the show goes on until the music stops and we get to see those who are left standing or hodling or swimming naked.
Despite all the slow-roll permitting and NIMBY restrictions, the number of new homes on the market has surpassed a 14-year high, with 23.3 percent more inventory/supply than at the same time last year. In fact, the supply of new homes is now back to levels last seen in 2005-2008, an era which might ring a bell or two.
Is it possible to do a yearly stacked chart of homes for sale by type and price ranges?
Curious to see which type of housing and what price point is driving these levels.
Unfortunately we don’t have the supply breakdown by price. But as we’ve previously highlighted, while the share of higher-end sales, which has been “mixing” the average sale price up, has started to drop with the return of lower-price inventory, it remains elevated versus the same time last year and significantly higher than in 2020 as well.
While there’s plenty of “need” and “desire” for housing, unfortunately that’s not the same thing as “demand,” which is a function of price (as you correctly tie together but the media and industry folks commonly flub).
If interests rates have doubled from 3 to 6 percent, won’t prices have to drop by a massive margin to make the same house at 6 as affordable as it was when it was at 3 percent?
Yes, though if rates are up because of inflation of wages/salaries, then it would balance out. I haven’t seen much reporting on how salaries are changing but clearly some hourly wages have increased as labor has become scarce. It won’t matter much (directly) to multimillion home prices if wages at fast food restaurants rise to $19 from $15.
What’s happening at big tech companies? Fewer, but better paid employees? Everyone getting fired? Everyone getting hired? This is not my area of insider knowledge, but it doesn’t seem like professional salaries are increasing as rapidly as cpi inflation. (Or are they?)
Many attribute the inflation we are experiencing to covid induced government largesse. If this were the only factor, we should expect the price increases to melt away as the stimulus is digested (spent) fully. It’s not clear those price increases are magically going away.
Compared to how much equities have fallen, real estate prices have a ways to drop. Most signs are pointing to weakness in for sale housing.
Or as we outlined at the end of last year, multiple rate hikes this year “should translate into higher mortgage rates, less purchasing power for buyers and downward pressure on home values,” none of which should catch any plugged-in readers, other than the most obstinate, by surprise.
I am glad to have SS as a macro forecaster of real estate trends. At the end of calendar 2023, where will the following economic variables be?
-The Case Shiller index for the San Francisco MSA
-30Y Jumbo Fixed Mortgage Rates
-The Fed Funds Rate
-The total number of homes sold in San Francisco during calendar 2023
Insight into these factors would prove useful to plugged-in readers, and would be germane to the subject at hand. Dec 2023 is less than 15 months out. Surely these factors can be accurately predicted by an intelligent observer.
Those are great questions and exactly the kinds of analysis and forecasting we do for clients. But if you keep plugging in we’ll give you some pretty strong hints, at least in terms of directionality and turning points, as we do have a habit of giving away a little too much for free. Which brings us back to the market for new homes and what it portends…
Who are your clients? I thought this was an impartial news site?
We do market analysis and advisory work for large developers and high-net-worth individuals. Potential conflicts are always disclosed and never impact our coverage. Which brings us back to the market for new homes…
Oh wait, I know this one! “Prices have reached a permanently high plateau” I remember the good ol’ days …!!