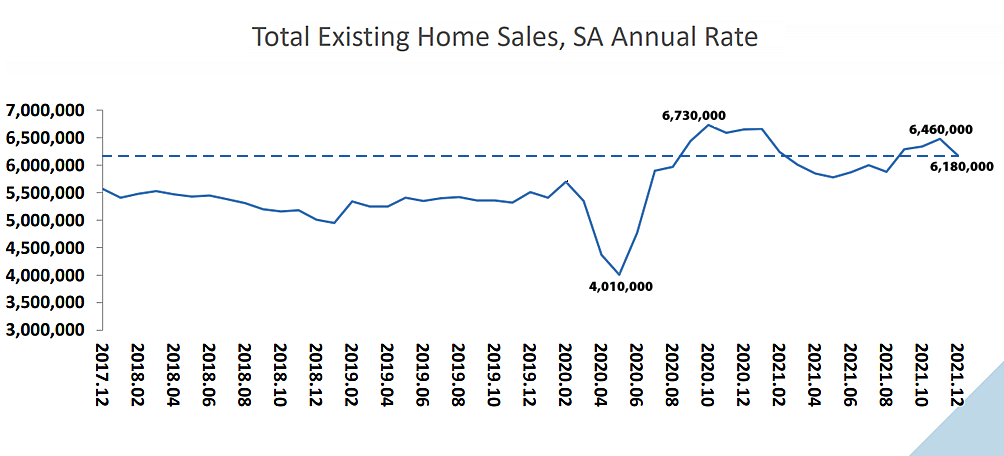
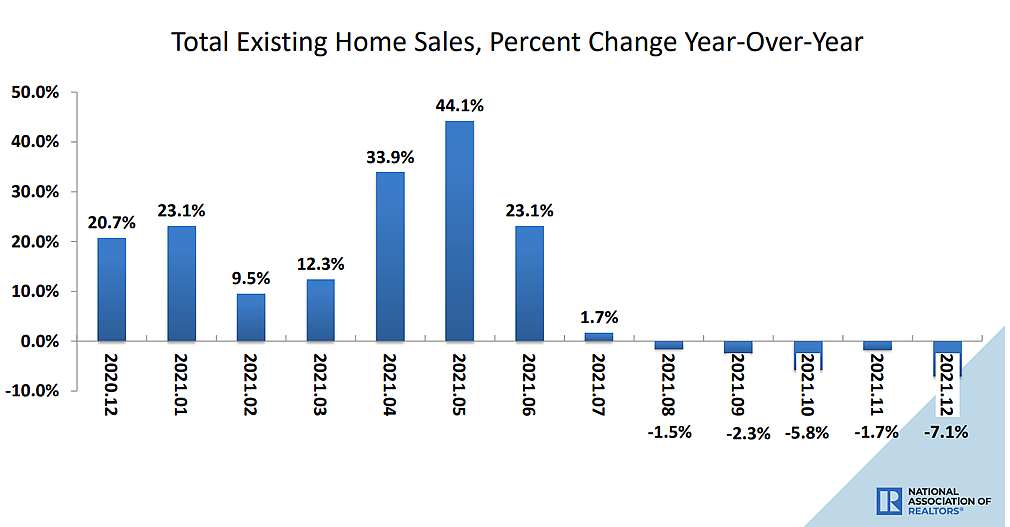
Having ticked up 1.9 percent in November, the seasonally adjusted pace of existing-home sales across the U.S. dropped 4.6 percent in December to an annual rate of 6.18 million sales, which was 7.1 percent lower than the year before and the fifth straight month with a year-over-year decline, according to data from the National Association of Realtors (NAR).
Net of sales and withdrawn listings, there were 910,000 existing homes left on the market at the end of December, which was 14.2 percent lower than at the end of 2020. But the inventory of new homes on the market is up nearly 40 percent to a 13-year high and purchase mortgage activity, which is a leading indicator, ended 2021 down.
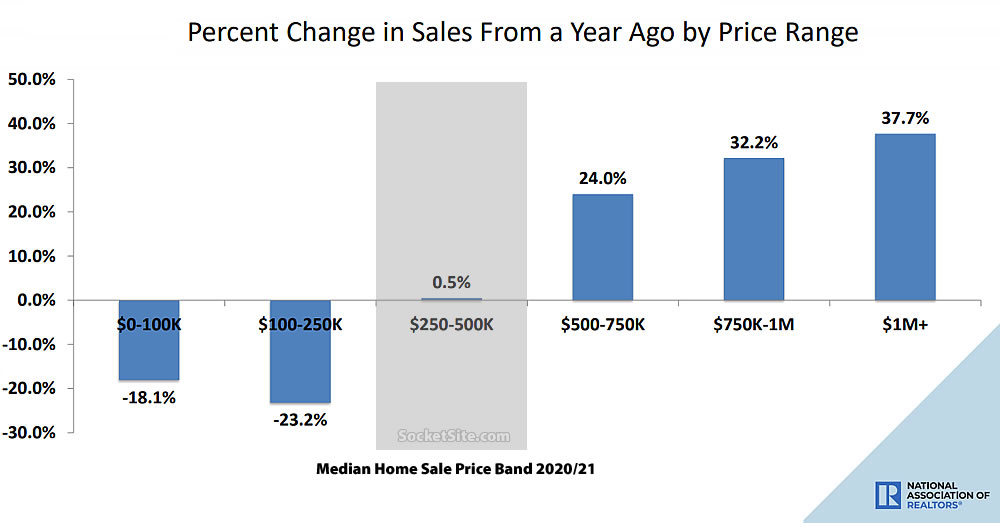
While the median existing-home sale price last month ($358,000) was 15.8 percent higher than it was at the end of 2020 ($309,200), but still a little lower than in June ($362,800), that’s with a dramatic shift in the mix of the homes that sold, or “a shift to the higher end of the market,” as is the case with the New Home market as well.
And while “sales for the entire year finished strong, reaching the highest annual level since 2006,” per Lawrence Yun, NAR’s chief economist, said strength was driven by sales being pushed from 2020 into 2021.
Interesting story in the NYT today about whether the rise in house prices is a bubble or merely reflective of demand.
I’m still surprised the “shift-in-mix” theory is offered here when the charts clearly show all houses trending up.
I think the stock market has more to come down, but I’m not sure if real estate will drop much.
Unfortunately, that’s not what the underlying data, nor even the “charts,” actually show.
If all the homes in the market increase in value, the result is the same as you last chart or graphic portrayal of data or whatever you would like to call it.
Show changes in value by some other metric like square footage and one could make an argument about mix.
Looking at prices changing and inferring conclusions about a change in mix is like comparing heights of a class of kids between kindergarten and third grade and observing that the class composition has changed from one of short kids to one made up of taller kids.
Everyone is growing.
That’s incorrect.
Think of it as people moving on a ladder. While there will be fewer people on the lowest rungs, and more people at the very top, the number of people in the middle remains relatively unchanged if everyone is moving at an equal pace. Or in your example, understanding that the average height of the first and second graders should remain relatively constant, despite the fact that the kids are growing. Unless there’s something else that’s going on.
Regardless, our model isn’t simply based on existing home sales data, but the distribution of new home sales and purchase mortgage data as well. There’s a reason the industry likes to focus on the “median sale price” metric. And at least you’re not misquoting data this time around!
Expect “mix” to become an industry talking point as soon as the median sale price wanes with an uptick in the share of lower-end transactions.
If the US national housing market has not experienced a broad rally, and instead prices have remained constant, except that more expensive houses are selling in greater numbers and less expensive houses are selling in fewer numbers, then the “change-in-mix” intepretation of the final National Association of Realtors chart/graph makes perfect sense.
I think that first off inflation can no longer be ignored. While inflation was trivial there was little difference between real and nominal prices. But with inflation hitting 7%, this is no longer the case. Particularity in graphs like the one in the NYT article you called out “Share of U.S. metro areas where home prices grew at least 10 percent annually”. This graph shows a dramatic spike, but its not clear how significant that metric is when looking at nominal prices during periods of high inflation.
Looking just a real prices, I’m surprised that you find a “shift-in-mix” surprising! As people shift to working from home they are looking towards larger spaces.
I think the demand is real, but the limitation on supply I think is only transitory. When people were flooding into cities such as SF and NYC, prices surged for a long time because supply in places like that is very inelastic. It’s very slow and hard to build in those places with limited land upon which to build. The rest of the US, by contrast, is vast and building in general is cheap and easy. Pandemic disruptions have snarled supply chains and made building a chore right now. But I don’t think this will last forever.
I think we are seeing partly inflation, partly change in mix (larger nicer homes being more in demand , the pandemic being economically kinder to high earners) and partly high demand hitting low supply. Inflation may stick around for a while. But I think the real apples to apples price surge will subside once it becomes easier for supply to come online.