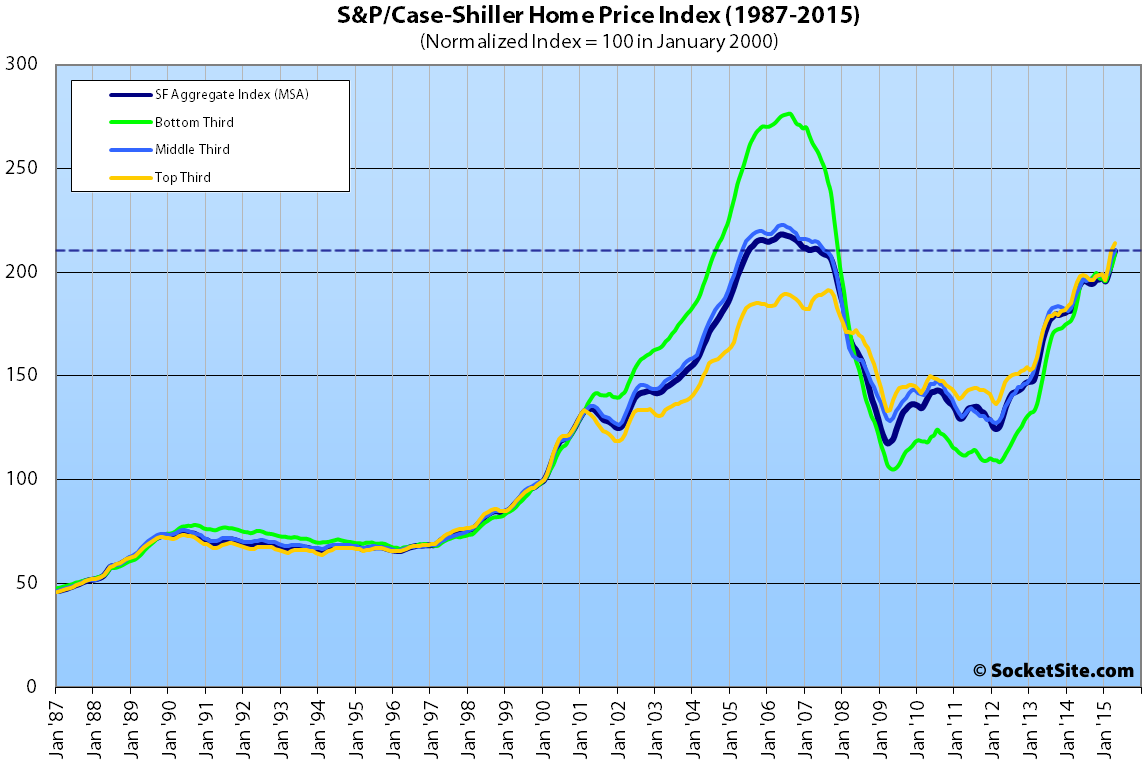
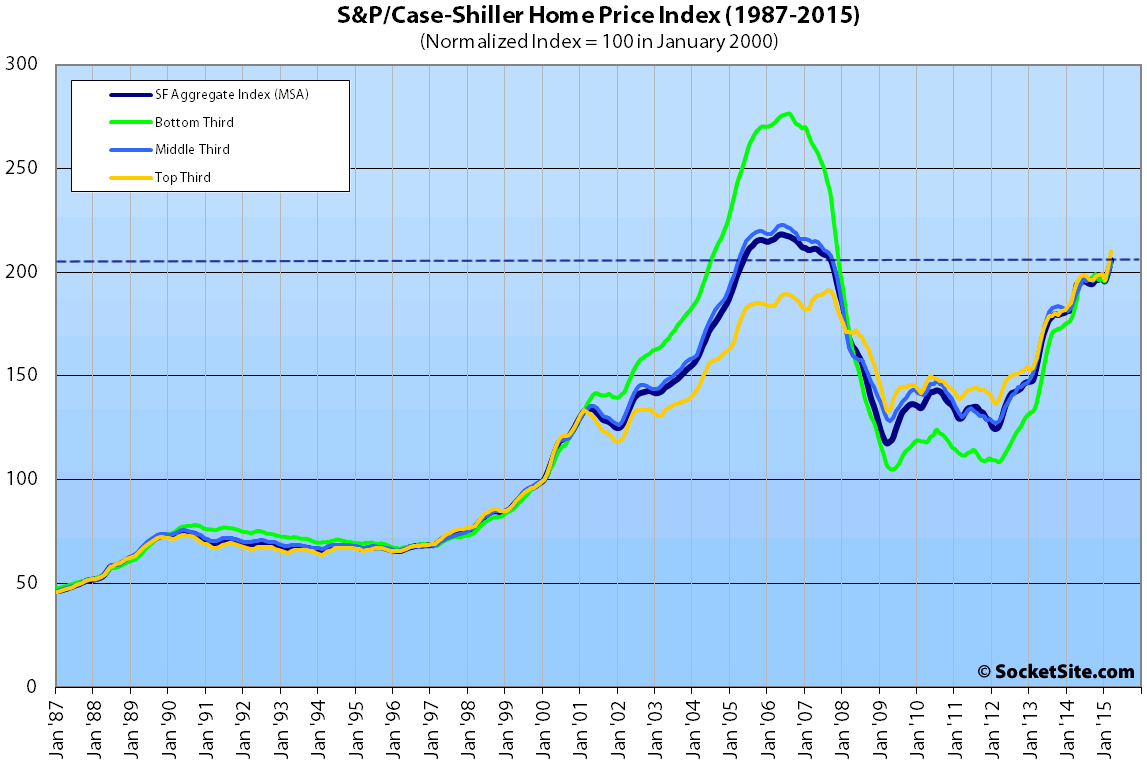
Single-family home and condominium values within the San Francisco Metropolitan Area gained 2.0 and 2.2 percent respectively in April, according to the latest S&P Case-Shiller Home Price Index.
The San Francisco index for single-family homes is running 10.0 percent higher on a year-over-year basis and is within 3.7 percent of a 2006 peak, having gained 55 percent since January of 2010.
The index for the bottom third of the market gained 2.9 percent in April and is running 11.9 percent higher versus the same time last year; the index for middle third of the market gained 2.3 percent, up 10.6 percent year-over-year; and the index for the top third of the market increased 1.8 percent in April to an all-time high and is up 9.5 percent year-over-year.
According to the index, single-family home values for the bottom third of the market in the San Francisco MSA have doubled since 2009 and are back to just below August 2004 levels (24 percent below an August 2006 peak); the middle third is back to just below May 2005 levels (5 percent below a May 2006 peak); and home values for the top third of the market are at an all-time high, 11.8 percent above their previous peak in August of 2007.
San Francisco condo values gained 2.2 percent in April and are running 13.8 percent higher on a year-over-year basis, 13.8 percent higher than at the peak of the previous cycle in October 2005.
For the broader 10-City U.S. composite index, home values gained 0.9 percent in April and are running 4.6 percent higher on a year-over-year basis but remain 15.2 percent below a June 2006 peak.
From David Blitzer, the Managing Director and Chairman of the Index Committee at S&P Dow Jones Indices:
“Home prices continue to rise across the country, but the pace is not accelerating.
Moreover, consumer expectations are consistent with the current pace of price increases. A recent national survey published by the New York Fed showed the average expected price increase among both owners and renters is 4.1%. Both the current rate of home price increases and the consumers’ expectations are a bit lower than the long term annual price change of 4.9% since 1975. These figures, however, do not adjust for inflation.
The real, or inflation adjusted, price change since 1975 is one percent per year. Given the current inflation rate of under two percent, real home prices today are rising more quickly than is typical.”
The long-term average annual home price appreciation for San Francisco measured 4.2% back in 2006, at which point the city was deemed “bubble-proof,” in part due to the inability to build on large swaths of underdeveloped land, such as Treasure Island.
Our standard SocketSite S&P/Case-Shiller footnote: The S&P/Case-Shiller home price indices include San Francisco, San Mateo, Marin, Contra Costa, and Alameda in the “San Francisco” index (i.e., greater MSA) and are imperfect in factoring out changes in property values due to improvements versus appreciation (although they try their best).


Who is going to be the first numbskull to call for fading the new high? Some bubble talk perhaps?
The trend is your friend. However, I shall wait for a pullback before my next strike.
I think you just called yourself a numbskull, but I agree that it doesn’t seem like a great time to go all-in on SF residential.
Read this and then mock the bubble talk.
correlating median housing price directly with median income seems to be the gist of that editorial. that’s a pretty flawed argument. most people rent. most people pay rent controlled rent. not that many properties trade. it’s probably fair to say that a lot of would be buyers do make six, seven times the median income. so, i don’t know if it’s mocking, but that was pretty flawed.
Written by some journalist with no skin in the game – I give it zero credence. As long as the market is artificially constrained by the gang of 4, demand will remain. My strategy is to accumulate trophy properties and rid them of rent control [tenants]. My money is where my mouth is. I play the inverse game to Campos, Kim, Mar & Avalos, which makes it a foolproof strategy, as it is inherently anti-fool.
Haha no argument from me about the Gang of 4. Mind-boggling amount of ignorance and stupidity. But make no mistake, this is a bubble. It’s not like ’06. Mostly a tech bubble, but housing has benefited greatly from all those high-paid tech employees. And when they go away, so will people’s ability to pay current rents and current home prices. That day will come. And it will probably be a good buying opportunity.
what causes the inevitable tech bust?
I have a similar opinion but am still trying to figure why these employees would leave. The roster of my last airbnb corporate tenants read like a Rolodex of the best and brightest. GOOG, Genentech, AAPL, etc… These companies sell high value intellectual property-based products on the global market, and the center of their intellectual property generation is here!
Yes there are many start-ups who have no other ambition than to be the next big thing, just like in 1998. These could disappear during a major tech downturn, but its impact would not be felt that much, I think.
The key in SF is still the utterly ridiculous imbalance between demand and supply.
What if the tech employees don’t go away?
How could the tech bubble burst? Quick explainer is this: many, probably most, and maybe nearly all, of the companies with $1B+ valuations won’t achieve the revenue that their investors expect, and they will demand some kind of exit, meaning acquisitions at fire-sale prices or in some cases, shutdown. Then it would spread to the funding environment of smaller startups, suddenly many of whom would not get a next round of financing, and then shut down.
Most likely companies to go first, IMO, are Zynga, Square, and possibly Twitter. Other companies are total guesses, like Box or Pinterest. Chances are many big names like that just won’t make it. Longer term, hard for me to see how Yahoo survives. HP is probably screwed, also. And this is just the big companies I know…there are hundreds more that aren’t so famous that employ a total of many many thousands of highly paid engineers and staff.
You’d have decreasing employment, and decreasing demand for real estate. Lots of people would jsut leave the region. Some people are sitting on the sidelines right now with secure jobs, and they will buoy the real estate market for a while, but it will be temporary. Nevertheless, I doubt prices (purely gut feeling) go down much below where they were in 2010 or 2011…which would still be a major reduction.
Many tech companies are here to stay for the forseeable future, guaranteeing that the Bay Area remains expensive. (But not THIS expensive.)
This WSJ article is a good one about the current tech bubble. While it isn’t as big as 1999, it is overwhelmingly focused in SF. While there won’t necessarily be nation-wide ramifications since a lot of these companies aren’t public, SF will absolutely feel the effects when it bursts.
couldn’t the hundreds more not famous that you don’t know argument be flipped to say there’s a culture of relative tech stability here?
I don’t understand your question – or perhaps you aren’t familiar with certain aspects of pre-profit tech companies here (i.e. the ones that will mostly go.) They literally are losing money every month. Sure there’s relative tech stability – as I stated, “many” companies are here to stay for forseeable future. Salesforce, Google, Facebook,much biotech, etc. But if you think that if, say, 50,000 jobs disappear in the region from money-losing companies, that those 50,000 employees will be immediately snapped up with no impact on the regional economy, I say no way. BTW, over 200,000 jobs were lost in the last bubble. The scale is hard to appreciate.
There is no question at all that there will be a correction – the question is the degree. “Only” 10k jobs lost? Barely noticeable and minimal impact on real estate, IMO. . 50k+ jobs lost? Significant. 100k+? Major. I would bet the farm on “significant” at a minimum. But that’s me. The other effect is a chill in people’s consumption after this happens…I suspect a lot of people are spending money expecting much more to flow in. Behavior will change once unicorn dreams die.
I know that the bottom/middle/top third cutoff prices change every month and the top third is the only relevant trend for SF but is it known what the cutoff dollar amounts are now?
The top third is NOT the only relevant teir for San Francisco proper. Far from it.
While the current breakpoint from the middle to high tier in San Francisco is $902,901, that isn’t the current minimum value of homes in the top tier but rather the minimum price that had been paid for a home in the tier prior to its most recent sale.
A single-family home which was purchased for $900,000 in 2010 (at which point the median sale price for a property in San Francisco was $650,000) and recently resold for $1.3 million would currently fall within the middle tier of the index, as would the majority of homes in the city.
Any reports tying the breakpoint dollar amounts to current market values are categorically wrong and demonstrate a fundamental misunderstanding and misrepresentation of the index.
Thanks for the clarification and I have been looking at these reports incorrectly but I find the index even more difficult to interpret. If the tiered cutoffs are based upon the previous sale price, wouldn’t the time between sales have a big impact? It would be interesting to see if the time between sales is different for each tier. I speculate the high tier are properties held for less time than the low tier. If so, how much of the index is influenced by appreciation versus duration between sales?
Another symptom of the crazy crazy state of affairs in San Francisco:
SF has become the city with the priciest hotels in the world.
That report can’t do basic math. Looking at the numbers, SF was highest last year too, but states otherwise.
With respect to basic math, if the average cost of a hotel room in San Francisco is currently $397, which is 88.2 percent higher than a year ago, then the average rate in San Francisco was $211 last year (which wouldn’t have cracked the list’s top ten).
And if the average cost of a hotel room in Geneva is currently $292, which is 5.2 percent lower than a year ago, then the average rate in Geneva was $308 last year (which would have landed it atop the list as reported).
Ha ha my bad. That’s percentage change, not dollar change. Doh.
MIsleading not to have % change specified in the last column, as reads as a change from prior year in hotel cost, but it is spelled out in the rest of the article.
The alternate headline would be – “Bay Area Home Values the least affordable ever”…..
Affordable housing is a good thing. It raises the quality of life for everyone – not just the Pacific Heights set.