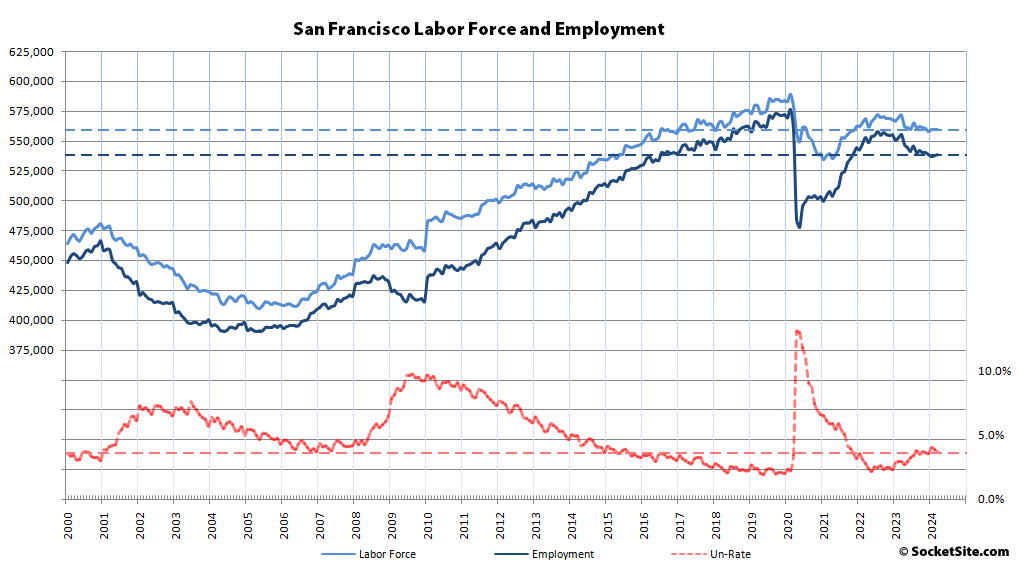
While the net number of San Francisco residents with a job increased by 1,200 in March to 538,800, there were still over 16,000 fewer employed residents in the city than there were at the same time last year, representing the second largest year-over-year drop in local employment in three years. And as such, there are still 37,000 fewer employed residents in San Francisco than there were in February of 2020, prior to the pandemic really having hit, and 30,000 fewer people in the local labor force (559,400), all despite an unemployment rate of just 3.7 percent and the ongoing “AI Boom!”
At the same time, while the number of employed East Bay residents inched up by 7,200 in March to 1,511,400, there were still 15,000 fewer employed East Bay residents than there were at the same time last year and 59,000 fewer employed residents than there were prior to the pandemic, with 34,000 fewer people in the East Bay labor force (1,586,700) and an unemployment rate of 4.7 percent.

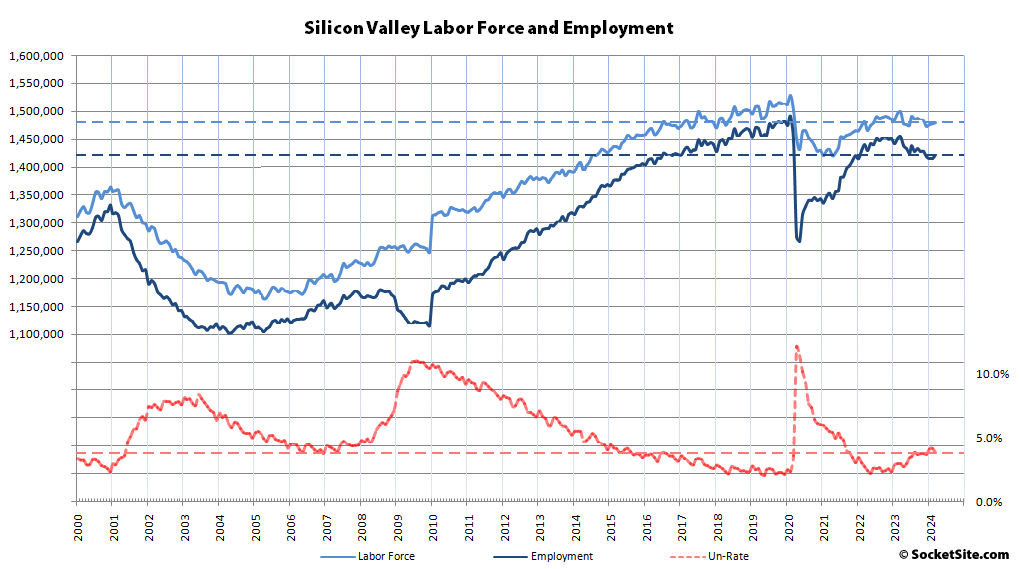
The number of employed residents spread across San Mateo and Santa Clara Counties inched up by 7,000 to 1,423,000 in March but was still down by 31,000 on a year-over-year basis, with 68,000 fewer employed people in Silicon Valley than there were prior to the pandemic and 47,000 fewer people in the local labor force (1,480,500) for an unemployment rate of 3.9 percent.
Net employment spread across Marin, Napa and Sonoma counties ticked up for the third month in a row, from 437,200 in February to 438,800 in March and was up by 1,800 on a year-over-year basis but still down by 18,000 versus prior to the pandemic, with nearly 13,000 fewer people in the combined labor force (457,100) and an unemployment rate of 4.0 percent.
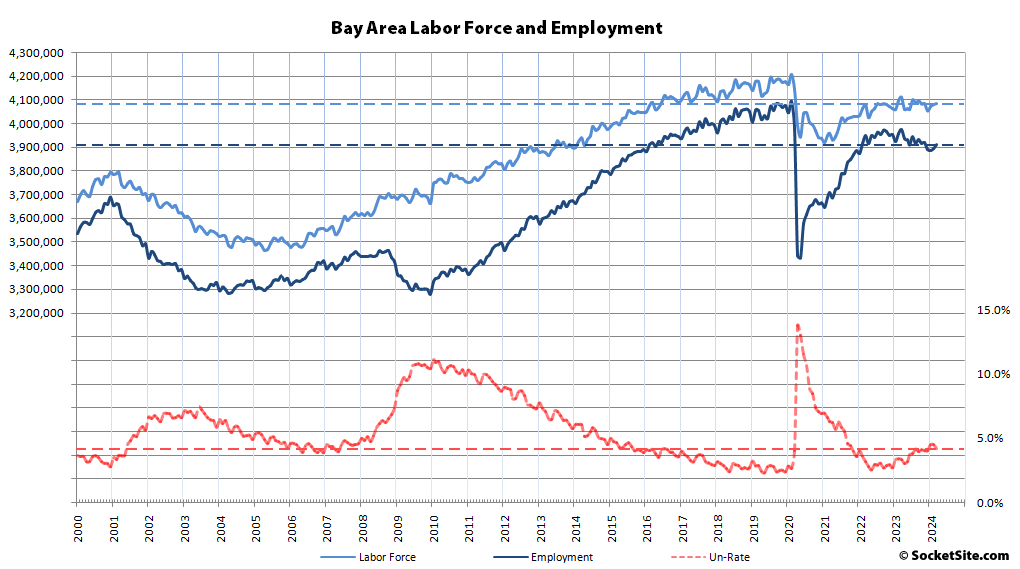
And as such, the net number of Bay Area residents with a job inched up by 17,000 in March to 3,912,000 but was still down by 61,000 on a year-over-year basis, representing the eleventh straight month with a year-over-year decline, with 182,000 fewer employed residents than there were prior to the pandemic, over 120,000 fewer people in the labor force and local employment back to early 2016 levels but now holding versus trending down. We’ll keep you posted and plugged-in.