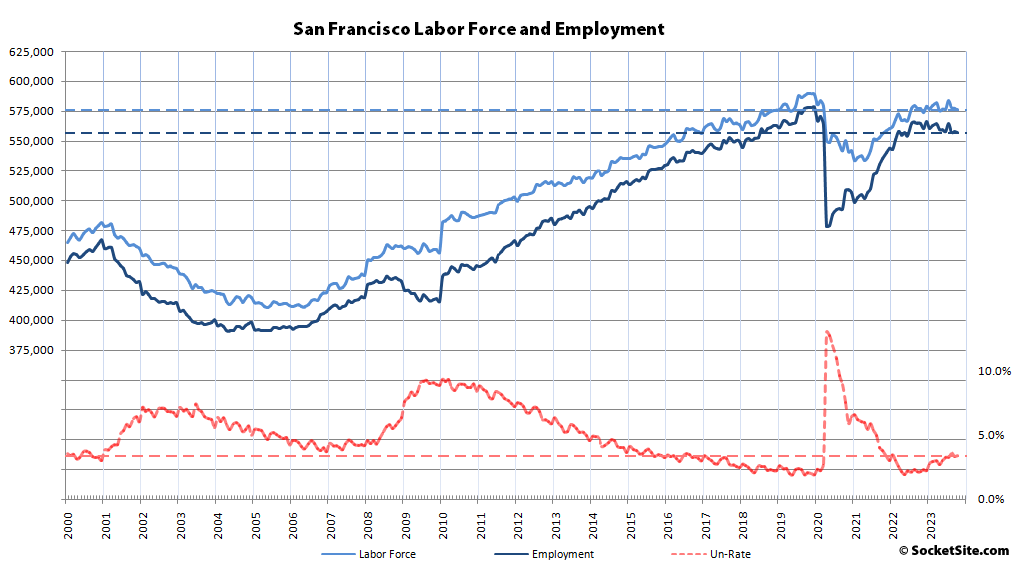
Having inched up by an upwardly revised 700 in September, the number of San Francisco residents with a job slipped by 700 in October and is back down to 557,000, which is down by 7,400 on a year-over-year basis, representing the fourth straight month with a year-over-year decline since the post-pandemic recovery began, with over 20,000 fewer employed people in San Francisco than there were at the end of 2019, prior to the pandemic, and nearly 13,000 fewer people in the local labor force (576,700), despite “an unemployment rate of just 3.4 percent.”
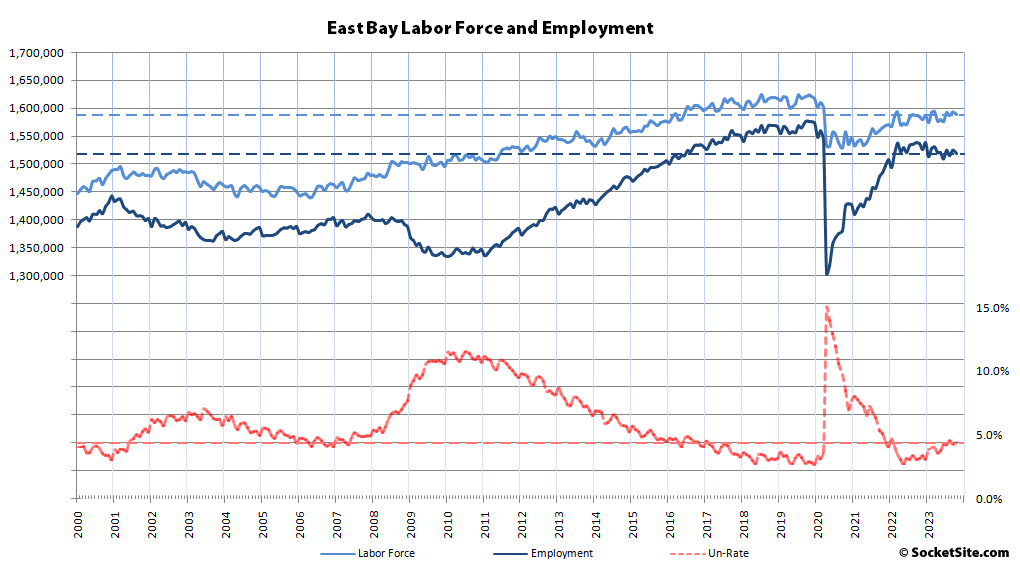
At the same time, the number of employed East Bay residents slipped by 5,600 last month and was down by 16,800 on year-over-year basis to 1,519,200, with over 54,000 fewer employed residents than there were prior to the pandemic, over 27,000 fewer people in the labor force (1,589,400) and an unemployment rate of 4.4 percent.
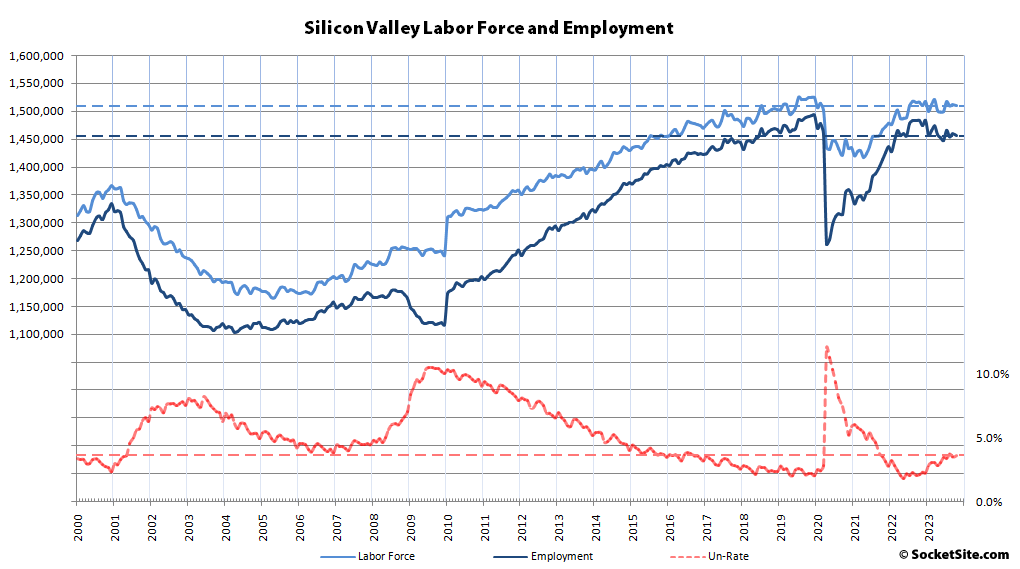
The number of employed residents spread across San Mateo and Santa Clara Counties slipped by 2,300 in October to 1,456,800 and was down by 27,200 on a year-over-year basis, with nearly 36,000 fewer employed people in Silicon Valley than there were prior to the pandemic and over nearly 13,000 fewer people in the local labor force (1,510,900) despite an unemployment rate of only 3.6 percent.
Net employment across Marin, Napa and Sonoma counties ticked down by 3,300 in October to 439,900 but was still up by 2,800 on a year-over-year basis, but with over 21,000 fewer employed residents than there were prior to the pandemic and nearly 16,000 fewer people in the combined labor force (456,300) and an unemployment rate of 3.6 percent.
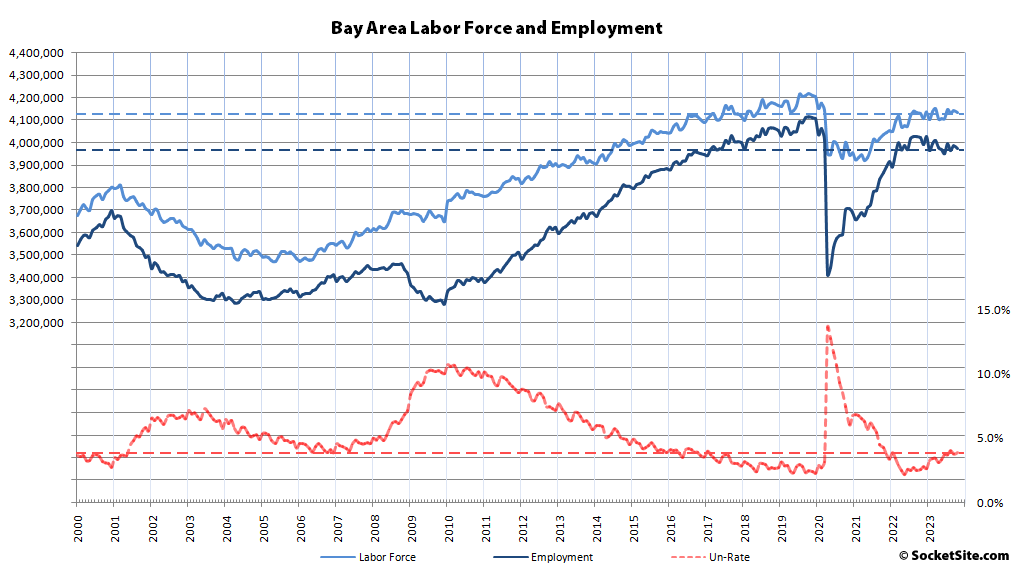
And as such, the net number of Bay Area residents with a job (3,972,900) slipped by 11,900 in October and was down by 48,600 on a year-over-year basis, representing the sixth straight month with a year-over-year decline, with over 132,000 fewer employed residents than there were prior to the pandemic, nearly 69,000 fewer people in the labor force, and an unemployment rate of “only 3.9 percent.”
Multi-polar world is here. In the Uni-polar world between 1992 and 2020, SF emerged the gigantic tech-hub leveraging US’ global dominance to penetrate markets worldwide in software, hardware & services. In the Multi-polar world, we are already seeing increasing market localization and avoidance of US technologies where possible: for national security and/or development of local talent pool. Any software superiority US has accrued is slowly and surely being eroded. Services have long departed. Hardware superiority remains for now but several challenges and competitors exist and are making fast progress.
The consequence: As companies struggle with maintaining profitability in a high interest rate environment along with emerging hyper global competitiveness, there will be increasing pressure to hire economically and deliver higher productivity. Very high housing prices in SF Bay Area run counter to this requirement.
The average un-employment rate between 2009 and 2013 is where we are headed in this high rate environment, in my view.
While I agree that other locations are investing in competing with SF Bay Area tech, it isn’t a sharp transition triggered by the pandemic. First, globally distributed tech has been around since before anyone used the term Silicon Valley, they just didn’t see the meteoric rise that the valley had in the 1980s. Secondly, leveraging low cost markets to improve competitiveness has also been around for decades and really started accelerating in the late 1990s. Still most of that offshore R&D is tied to companies headquartered here. While homegrown companies like Samsung and Huawei have indeed emerged to challenge the USA, that too occurred long before the pandemic.
Pandemic was the catalyst but not the trigger. It boosted the momentum already underway. Multi-polarity has been in the works since at least Great Financial Crisis of 2008, if not since at least LTCM crisis in 1998. Now its assuming hitherto unknown proportions and imparting unforeseen competitive global pressure. US’ global dominance is being eroded. Success of SF is because of prior existing US’ Uni-polar condition. As goes US, so will SF. Those days of US singularly imposing its will on the world are over.
And again, there’s no time horizon for this all to play out mentioned.
It’s worth noting, just for context, that if readers had interpreted cave_dweller’s comments pushing the idea of de-dollarization here during the Winter of 2023 seriously, interpreted that as his bearishness on the U.S. dollar, decided that was just a little vague and so it was worthwhile to put money to work taking the other side of his sentiment, and implemented that investment thesis in the simplest possible way (without the need for a complicated foreign exchange account) — by buying the Invesco DB US Dollar Index Bullish ETF, as of today you’d be up by almost 3.6 percent.
If you’d taken a bit more sophisticated approach and somehow bet against the Chinese Yuan (CNY), you’d be up even more, as the US Dollar purchased about 6.9 Chinese Yuan in early March and on Friday your dollar bought about 4.2 percent more!
No need to attribute to me what is a global phenomenon. Bureau of International Settlements: Revisiting the international role of the US dollar
If you think about it – rising housing prices in the last 2 decades is a form of de-dollarization. The search for yield sought non-dollar assets in exchange for dollars (though denominated in dollar value). Its kind of unhealthy as it suggests falling productivity in other sectors and by extension a weaker appetite for employment which is playing out now. High cost of rent only makes it worse.
Macrotrends has an interactive 43 Year Chart of historical data showing the broad price-adjusted U.S. dollar index published by the Federal Reserve on their website. The index is adjusted for the aggregated home inflation rates of all included currencies. If you slowly roll your mouse cursor over the graph and hone in on Dec 1999, you’ll see that it shows the level is ‘100’. Over on the right-hand side at Dec 2019 (the latest date for which they are showing the data supplied by The Fed), it shows the level is…101, with up and down in between.
Over and above that, it seems to me that the main thing shown by “the search for yield sought non-dollar assets in exchange for dollars” is that holding cash and cash equivalents is and was never a very wise investment, even semi-informed market participants are always going to want a return over the rate of inflation and while homes aren’t a perfect inflation hedge, they’re better than nothing and over many time periods present a very attractive return on an inflation-adjusted basis.
In pre-covid era there was direct correlation between the SF office vacancy rate, and the unemployment rate, as well as the performance of nasdaq. All three lines on the graph would shadow each other. Not sure that direct correlation exists post-covid. In other words, just because the unemployment rate is low, or Nasdaq is recoverning, it shouldn’t be assumed that the SF office vacancy rate will automatically follow.