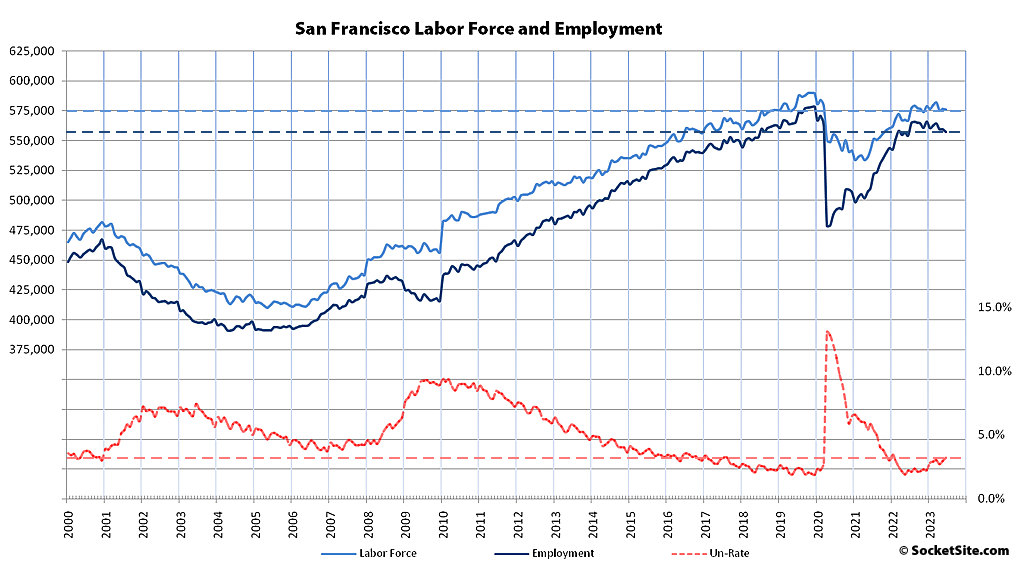
Having slipped in April and ticked down in May, the number of San Francisco residents with a job dropped by 2,000 to 557,400 in June. As such, there are still 3,000 more employed people in San Francisco than there were at the same time last year but 20,700 fewer employed than there were at the end of 2019, prior to the pandemic, with over 13,000 fewer people in the local labor force (575,900) and an unemployment rate of 3.2 percent
At the same time, the number of employed East Bay residents dropped by 12,400 last month to just 1,508,000, representing 12,800 fewer employed East Bay residents than at the same time last year and nearly 66,000 fewer employed residents than prior to the pandemic, with over 42,000 fewer people in the labor force (1,575,000) and an unemployment rate of 4.3 percent.
The number of employed residents spread across San Mateo and Santa Clara Counties ticked down by 3,200 in June to 1,449,500, representing 6,800 fewer employed residents than at the same time last year and 43,000 fewer employed people in Silicon Valley than there were prior to the pandemic with around 22,000 fewer people in the local labor force (1,501,300) for an unemployment rate of 3.5 percent.
Net employment across Marin, Napa and Sonoma counties ticked down by 1,500 in June to 436,000, roughly even with the same time last year but with over 25,000 fewer employed residents than there were prior to the pandemic and over 20,000 fewer people in the combined labor force (452,200) for an unemployment rate of 3.6 percent.
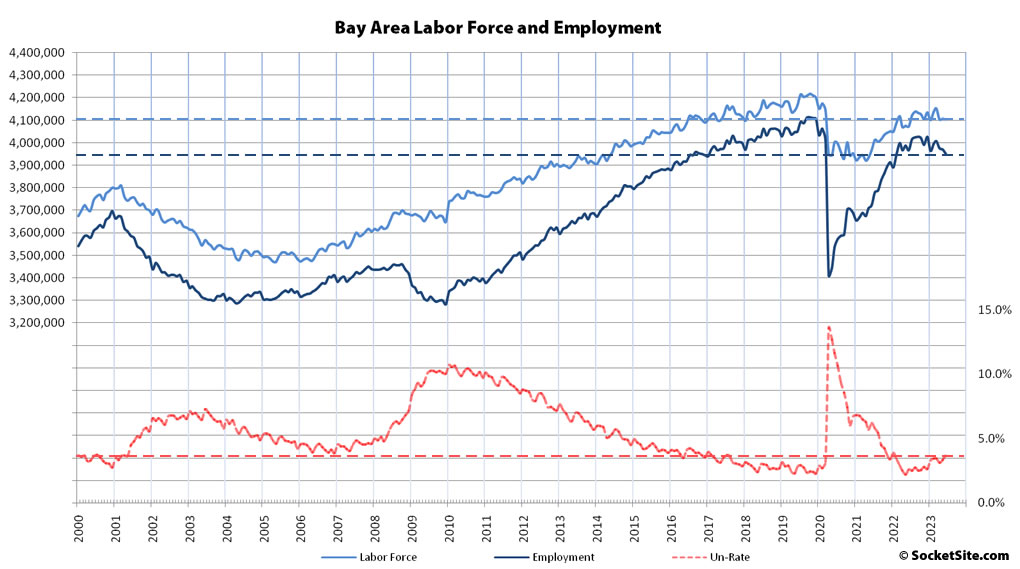
As such, the net number of Bay Area residents with a job dropped for the third month in a row, from 3,969,600 in May to 3,950,500 in June, with 17,000 fewer employed residents than at the same time last year, representing the second straight year-over-year decline in Bay Area employment, with 155,000 fewer employed residents than there were prior to the pandemic and nearly 100,000 fewer people in the labor force, but with an unemployment rate of “only 3.7 percent.”
And now, for an alternate POV (reconciling these often-at-odds-tho-you’d-think-they’d-be-the-same stats is on my ‘to do’ list….just not in the Top 3)
After a cursory comparison it seems to me the major difference is that ss is reporting “number of [insert relevant geographical area here] residents with a job” whereas George Avalos at the Bay Area News Group (who gets credibility points for citing where his data comes from — the state Employment Development Department) just reports gross changes in the number of jobs in the relevant geographical area. The difference is subtle, but worth noting. If you assume both are being careful about what they are reporting, then the difference in their characterizations of trends becomes understandable.
Here’s one ‘graph from the East Bay Times story that struck me:
I’m often astonished by stats like these and the fact that journalists never seem to write about the implications of it. Jobs are not fungible and the wages they pay are not randomly distributed.
The “tech sector” jobs where there is “some adjustment going on” are largely the ones that pay a living wage for someone in Santa Clara County (for example) working full time at a single job to be able to save up enough money to purchase a home from the amount of their wages left over after their month-to-month living expenses, taxes, student loan repayment obligations and retirement contributions. The service jobs in the “hotel, restaurant and drinking establishment sector” largely pay less than or just above the cost of living; many will be eligible to claim the Earned Income Tax Credit, so their taxes are negative and an employer-matched 401k contribution isn’t available. A substantial number of the service workers will have to work more than one of those jobs just to survive, paying rent for years on end, until they flee the Bay Area in search of an affordable place to support a family.
Yes, as you note one obvious difference is that SS reports “employed” by residence, whereas the EDD, I believe, is location of employment; so there’s inevitably some difference in people who come into – or leave – the respective metro areas to work. Certainly this would explain there not being a 1:1 match, tho it’s less obvious why the two would move in different directions. I believe SS also adjusts their numbers for seasonality, which could be an important factor within the year – or at least some parts of the year – but less so year-on-year.
All this having been said, it’s either amusing – or disturbing, depending on how interested one is in the topic – how often the headlines run 180° from one another:
Bay Area Employment Drops, Trending Down vs.
Bay Area hiring surges in June, powered by big South Bay job gains