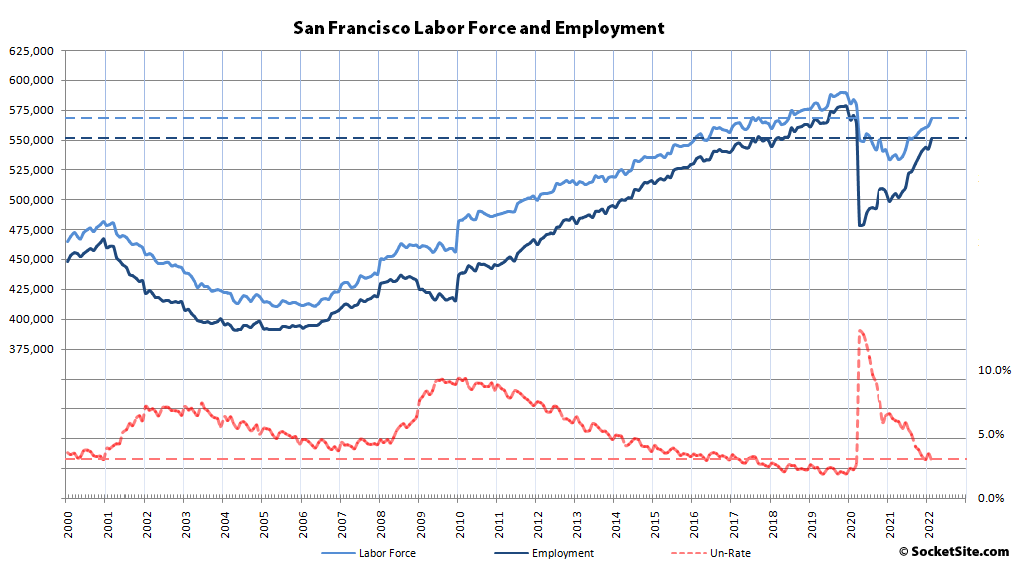
Having been downwardly revised, the net number of people living in San Francisco with a paycheck actually slipped by a thousand in January but then rebounded by 8,500 in February to 551,200, representing 48,400 more employed residents in the city than there were in February of last year and 72,500 more than in April of 2020 when pandemic-driven unemployment peaked at 13.0 percent (versus closer to 2 percent prior to the pandemic and 3.0 percent last month).
That being said, there are still 19,600 fewer employed people in San Francisco than there were prior to the pandemic and 15,800 fewer people in the labor force (568,100), but that’s a far cry from what’s being implied by some outdated census figures that are now making the rounds. In fact, the labor force in San Francisco is back to within 96 percent of its pre-pandemic count.
The number of East Bay residents with a paycheck, which dropped by an upwardly revised 13,300 in January, rebounded by 25,100 in February to 1,519,000, which is still 40,500 fewer than prior to the pandemic but 64,600 more than at the same time last year and 215,300 more than in April of 2020, with a blended unemployment rate of 4.1 percent.
Employment in both San Mateo and Santa Clara increased in February, by 6,700 and 13,100 respectively. And as such, there are now over 100,000 more employed people in the Valley (1,448,100) than there were at the same time last year and nearly 187,000 more than in April of 2020, but still 30,000 fewer than prior to the pandemic, with 24,500 fewer people in the labor force for an average unemployment rate of 2.8 percent.
Total employment across Marin, Napa and Sonoma counties increased by 7,900 in February to 434,500, representing 34,100 more employed residents that at the same time last year and 67,500 more than in April of 2020 but still 19,200 fewer than prior to the pandemic with 17,000 fewer people in the combined labor force (449,400) for an unemployment rate of 3.3 percent.
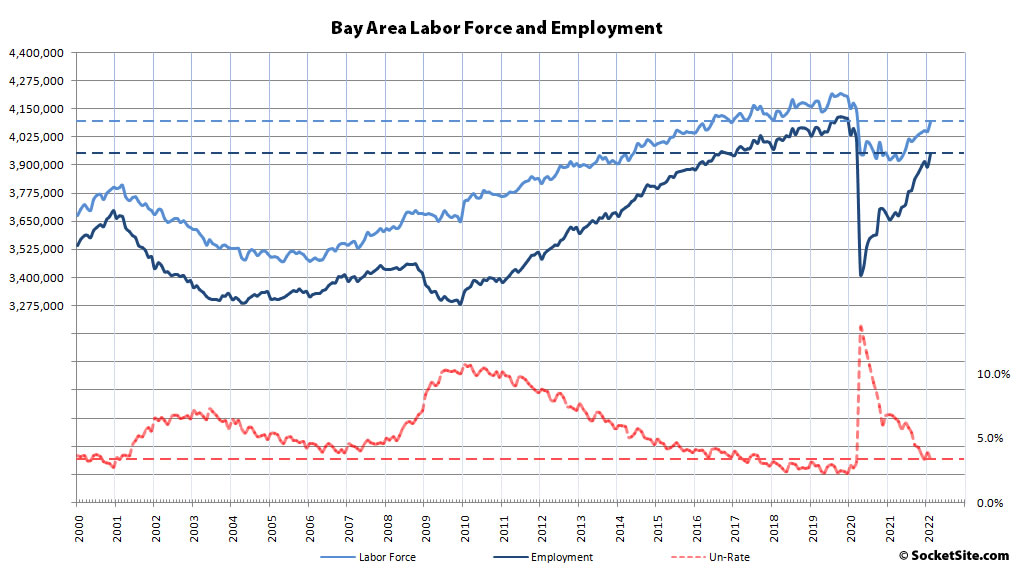
And as such, the number of Bay Area residents with a job increased by 61,300 last month to 3,952,800, with 284,100 more employed Bay Area residents than there were at the same time last year, over 541,000 jobs having been recovered since the second quarter of 2020 and total employment back to within 96 percent of the pre-pandemic count. But there are still 109,300 fewer employed Bay Area residents than there were prior to the pandemic having hit (4,062,100) and the labor force is still down by 83,300 to 4,091,200 for an average unemployment rate of 3.4 percent.
are we using the 2020 population as baseline? given that SF / Santa Clara each had a 6-7% drop in population over the last year, full employment might happen well short (though we don’t have a clear indicator of how much population has rebounded with folks moving back – so who’s to say)?
Per recently released US Census data SF lost 6.3% its population from July 2020 to July 2021. Second only to NYC which lost 6.6%. Santa Clara County fared better – losing 2.3% of its population.
As of July 2021, SF’s population had fallen to 815K. UC Berkeley reported the 3rd quarter 2021 exodus from SF exceeded the 3rd quarter 2020 exodus.
Once again, you’re quoting outdated and misleading stats.
While the labor force in San Francisco, which is highly correlated with the population, dropped from July 2020 to July 2021, it has since rebounded and is now higher than it was in July of 2020.
In fact, there are now 58,900 more people employed in San Francisco than there were in July of 2020 with 14,900 more people in the labor force.
No. As outlined above, “there are still 19,600 fewer employed people in San Francisco than there were prior to the pandemic and 15,800 fewer people in the labor force (568,100),” which is based on employment data and not the “outdated census figures that are now making the rounds,” census figures which misrepresent the current state of affairs despite being “recently released” and (mis)reported.
Looking at the trend lines, from 3/20 to 3/22 SF recovered the employment count it grew from 6/12 to 6/17, so about 2 yrs to recover about 5 years of organic growth.
The whole Bay Area is even slightly better as the bottom of the Covid crash matched the 2011 employment.
Unlikely that we will match the past couple of years (inflation, war, remote work, potential zombie apocalypse), but if we do, we are back to 3/20 employment by early 2023.
I appreciate these employment updates. May I kindly request you present them in a table to facilitate easy comparisons between the regions? Thanks for your consideration.