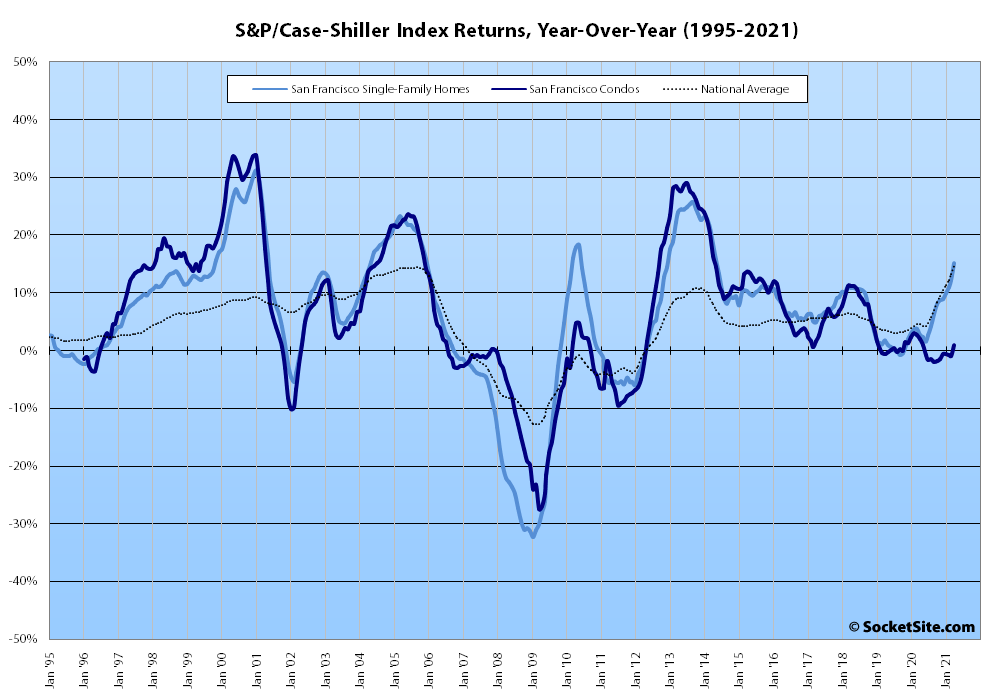
Having climbed 3.3 percent in March, the S&P CoreLogic Case-Shiller Index for single-family home values within the San Francisco Metropolitan Area – which includes the East Bay, North Bay and Peninsula – ticked up another 3.1 percent in April. And as such, the Bay Area index is now up 15.1 percent on a year-over-year basis, which is the largest year-over-year gain for the index since mid-2014 and above the year-over-year gain in the national index (14.6 percent) for the first time since the fourth quarter of 2018.
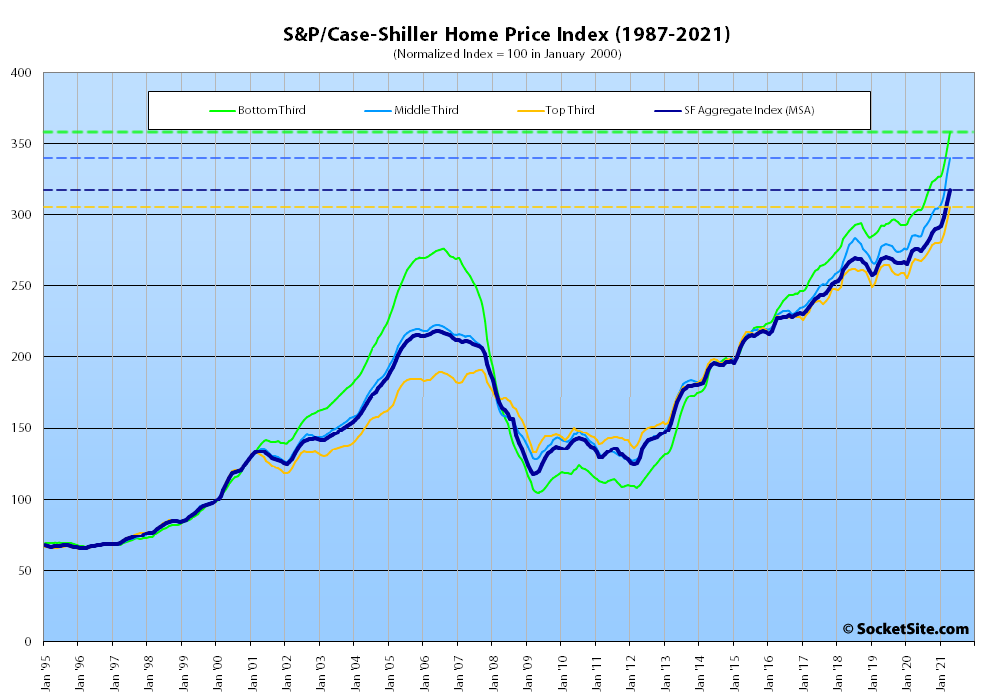
At a more granular level, the index for the least expensive third of the Bay Area market climbed another 3.5 percent in April and is 18.5 percent higher than at the same time last year; the index for the middle tier of the market also climbed 3.5 percent for a 19.0 percent year-over-year gain; and the index for the top third of the market increased by 3.2 percent for a year-over-year gain of 13.7 percent.
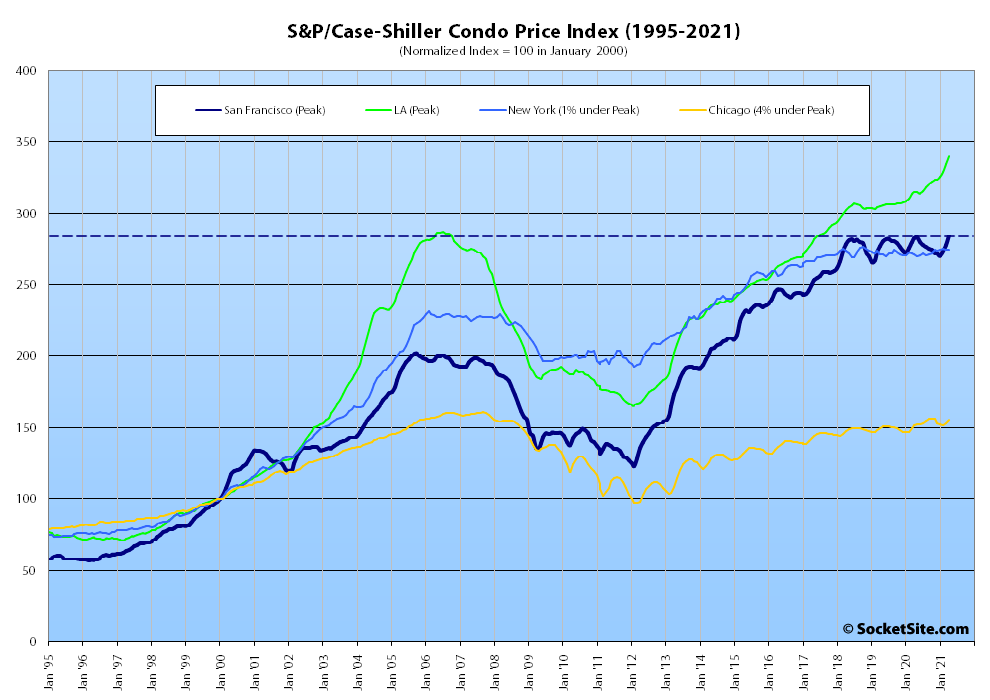
At the same time, the index for Bay Area condo values, which remains a leading indicator for the market at a whole, ticked up 2.6 percent from March to April, is up 0.9 percent on a year-over-year basis (representing the first year-over-year gain since May of last year) to an all-time high, with year-over-year gains of 8.1 percent, 2.3 percent and 1.0 percent in Los Angeles, Chicago and New York respectively.
Phoenix still leads the way in terms of indexed home price gains nationally, up 22.3 percent, year-over-year, followed by San Diego (up 21.6 percent) and Seattle (up 20.2 percent).
Our standard SocketSite S&P/Case-Shiller footnote: The S&P/Case-Shiller home price indices include San Francisco, San Mateo, Marin, Contra Costa and Alameda in the “San Francisco” index (i.e., greater MSA) and are imperfect in factoring out changes in property values due to improvements versus appreciation (although they try their best).
Fantastic news. What an amazing investment for owners over the years.