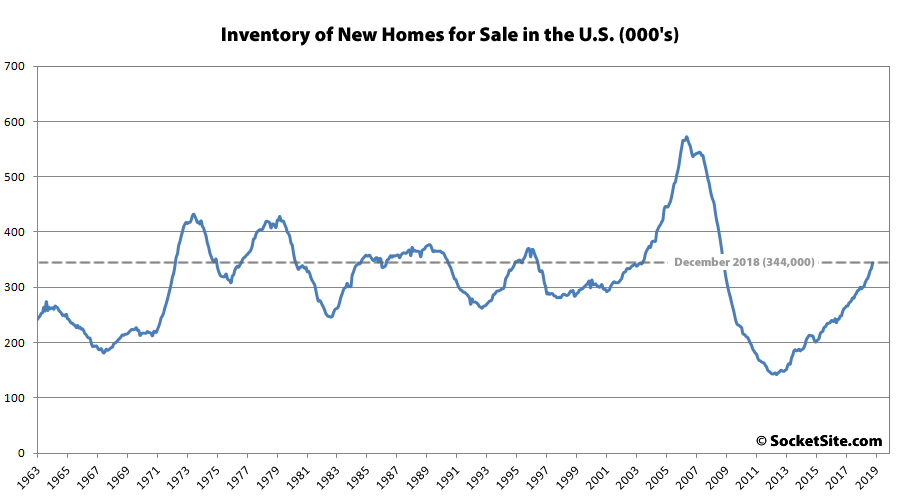
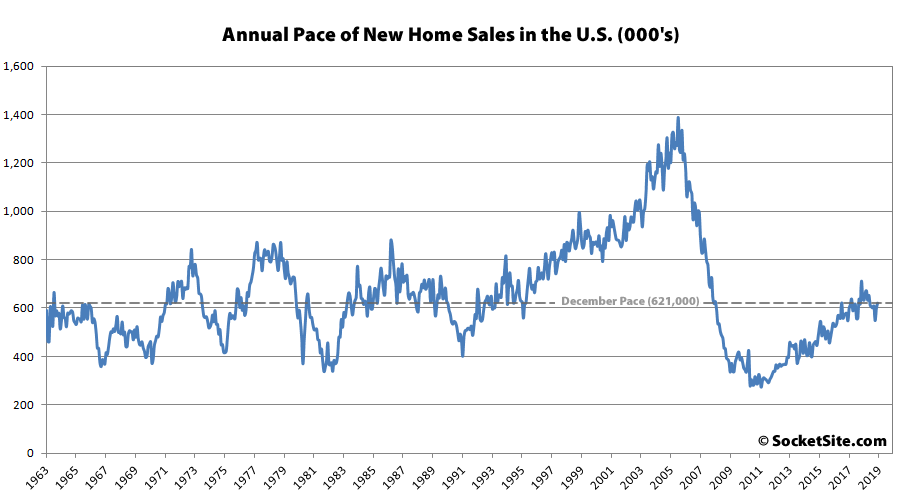
The pace of new single-family home sales in the U.S. ended 2018 at a seasonally adjusted rate of 621,000 sales, down 2.4 percent on a year-over-year basis but with a total of 1.5 percent more new homes having sold across all twelve months of 2018 versus 2017.
At the same time, the number of new single-family homes for sale across the county increased to 344,000, which is 17.0 percent higher on a year-over-year basis and a 10-year high, representing 6.6 months of available inventory.
The median sale price at the end of 2018 ($318,600) was down 7.2 percent versus at the end of 2017 ($343,300).
And out West, the pace of new single-family home sales ended 2018 at a seasonally adjusted rate of 143,000 sales, down 23.9 percent on a year-over-year basis with 0.5 percent fewer new homes having sold in 2018 versus the year before.


Don’t understand why you would not deflate this data by population or at least the number of households. In 1963, there were 55.27 Million households, so say 250,000 homes for sale means 1 new home for sale for every 221 households. Now, it’s 1 home for sale for every 370 households. Surely that is a more meaningful metric than just counting total homes for sale and ignoring population and housing growth over the last 60 years. You can download household data pretty easily.