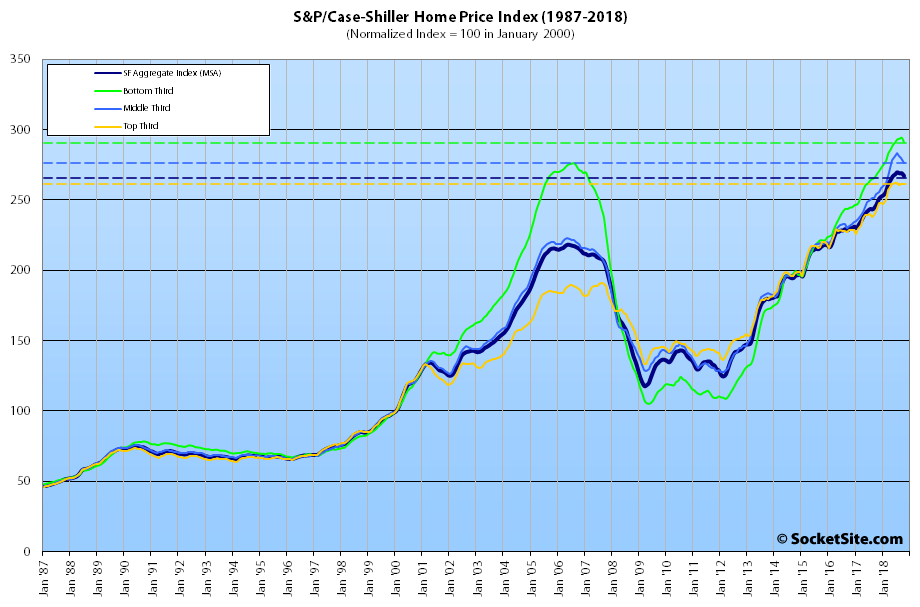
Having slipped 0.7 percent in October, the S&P CoreLogic Case-Shiller Index for single-family home values within the San Francisco Metropolitan Area – which includes the East Bay, North Bay and Peninsula – has shed a total of 1.0 percent over the past quarter and its year-over-year gain has dropped nearly three percentage points to 7.9 percent.
And for the first time since the third quarter of 2011, the index for the bottom third of the Bay Area market has dropped over a percent on a month-over-month basis, dropping 1.1 percent in October and pushing its year-over-year gain down from 10.7 to 8.3 percent. The index for the middle third of the market also shed 1.1 percent in October but remains 8.7 percent higher versus the same time last year while the index for the top third of the market was unchanged in October but its year-over-year gain dropped from 9.1 to 7.8 percent.
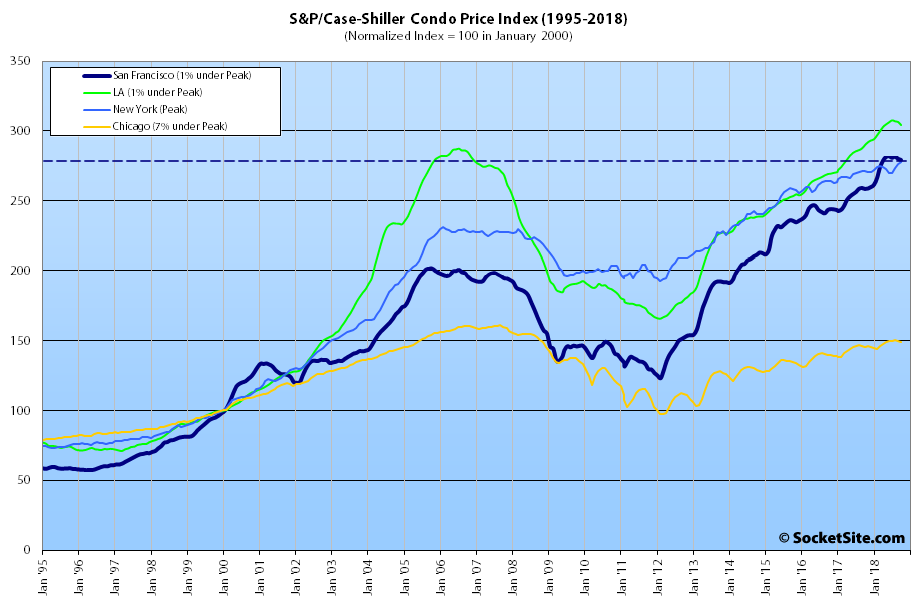
At the same time, having slipped 0.6 percent in September, the index for Bay Area condo values shed another 0.3 percent in October but remains 8.0 percent above its mark at the same time last year and 38.5 percent above its previous cycle peak in the fourth quarter of 2005.
And while Las Vegas is still leading the nation in terms of home price gains, up 12.8 percent year-over-year versus a national average of 5.5 percent, Phoenix (up 7.7 percent) has just displaced Seattle (7.3 percent) for the third highest year-over-year gain with San Francisco holding at number two. Yes, San Francisco is now bookended by Las Vegas and Phoenix, two cities which featured rather prominently in the last major downturn.
Our standard SocketSite S&P/Case-Shiller footnote: The S&P/Case-Shiller home price indices include San Francisco, San Mateo, Marin, Contra Costa and Alameda in the “San Francisco” index (i.e., greater MSA) and are imperfect in factoring out changes in property values due to improvements versus appreciation (although they try their best).


Shouldn’t the title read something like ‘Index for Bay Area Home Prices Slips and Fall’s?
[Editor’s Note: Previous typo since corrected (and comment co-opted above).]
Is this seasonally adjusted?
Looking back a few years, seems an end of the year slump is expected.
The San Francisco index hasn’t recorded an October decline since 2013. And there hasn’t been a quarterly decline totaling a percent (or more) since late 2011, early 2012.
Year over year price gain out of the double digits to a paltry 8%. Textbook bear market.
Or as some might say, “so far, so good!“
Crazy to think you could have bought a house in Chicago in 2007 and still be under water 12 years later….