Having gained 1.5 percent in April, the S&P CoreLogic Case-Shiller Index for single-family home values within the San Francisco Metropolitan Area – which includes the East Bay, North Bay and Peninsula – inched up 0.5 percent in May and the index for area condos gained 0.8 percent, lifting each index to new highs.
With May’s gain, the index for single-family home values is now running 5.4 percent higher versus the same time last year, driven by outsized gains at the lower end of the market.
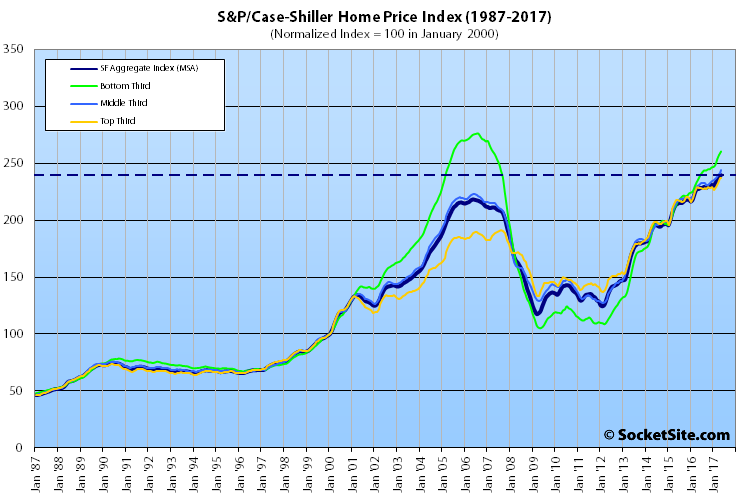
Having gained 1.1 percent in May, the index for the bottom third of the Bay Area market is running 10.2 higher versus the same time last year. The index for the middle third of the market is running 5.6 percent higher versus the same time last year having ticked up 1.0 percent in May. And the index for the top third of the market is running 3.8 percent higher versus the same time last year having slipped 0.1 percent in May.
And while the index for the top third of the market is running 23.9 percent above its previous peak ten years ago, the index for the bottom third of the market has another 5.7 percent to gain before its back to its 2006-era peak.
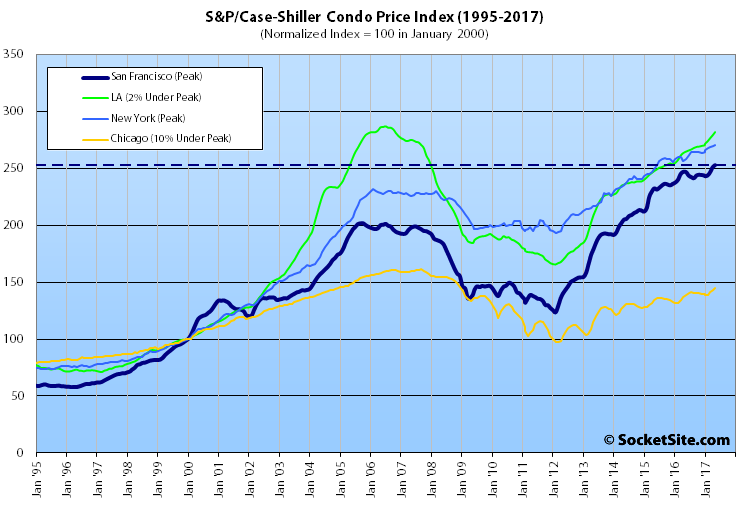
With its 0.8 percent gain in May, the index for Bay Area condos is running 2.4 percent higher versus the same time last year and 25.3 percent above its previous cycle peak in October 2005.
And for context, across the 20 major cities tracked by the home price index, Seattle, Portland and Denver reported the highest year-over-year gains, up 13.3 percent, 8.9 percent and 7.9 percent respectively versus a national average of 5.6 percent.
Our standard SocketSite S&P/Case-Shiller footnote: The S&P/Case-Shiller home price indices include San Francisco, San Mateo, Marin, Contra Costa and Alameda in the “San Francisco” index (i.e., greater MSA) and are imperfect in factoring out changes in property values due to improvements versus appreciation (although they try their best).
New price highs for both single family homes and condos. So much for the story line that the peak is far behind us. Low inventory and continuing high demand is keeping things pricey. Here is an example: 1160 Mission # 1012, small 1 BR sold in April 2015 for $715,000 and just sold yesterday for $750,000 after 25 days on the market, up 5% (could have been picked up for $460,000 in 2009). Anyone looking for big discounts off the 2014 or 2015 or 2016 price is going to be sorely disappointed. But it is good news that gains are now quite modest as prices have basically plateaued, at least for condos.
[Editor’s Note: Or perhaps they simply need to look a little harder at the market.]
That’s strange, because the broader index for condos is up over 10 percent since April 2015. And a 4.9 percent gain from the second quarter of 2015 equals average annual appreciation of 2.1 percent while the condo index gained 11.4 percent in 2015 alone. It’s almost as if the numbers suggest that all of the appreciation for your example was front loaded (at best).
Maybe condos are also still appreciating nicely. I’m just looking at the condo chart you posted. Looks like basically flat (slightly up) in the last year or so, after four years of very strong gains.
It’s a good chart. Of course, the San Francisco index includes the Peninsula and East Bay. Any thoughts on how those markets might be performing relative to San Francisco and what that might mean if you’re seeing basically flat for the index overall?
So you think San Francisco is up 5% in the last couple years but the surrounding counties are up more, perhaps 10%? Could be. Either way, no downturn (just the opposite) in SF or its environs, contrary to an oft-asserted story line here. I guess we’re just arguing now about how large the SF gains have been since 2015.
Not quite. We’re suggesting that if you honestly believe that the condo market in San Francisco appreciated less than 5 percent in 2015, which would have lagged the market in the US as a whole, you might be more out of touch rather than simply obstinate.
At the same time, if you’re read of the index is basically flat over the past year, and the East Bay and Peninsula have been outperforming San Francisco proper, the math would suggest that the market hasn’t been basically flat in San Francisco.
The SFR market is divided into 3rds, yet all condos are lumped together. Maybe perhaps lower end condos don’t attract the same buyers as high end condos? Is the 11.4 percent gain in the condo index an index of only condos in the city limits of SF? I doubt it.
Aren’t things normally at a high at the top of the cycle? If you look at the last cycle, midway in ’06 there was even a little bump up at the top. The top tier even had one last bump of glory at the end of ’07.
Last time the top tier had a good 2.5 years of kicking around the top before the decline began in earnest.
Do you even have any theory or mechanism that would support your repeated implications that this time is different in that this time the market has to fall right away or not at all?
Not sure if that question is directed at me, but I’ve never even suggested that the market has to fall right away or not at all. Not really sure what that even means – “to fall right away”? My point is that SS and others keep implying, or stating directly, that the SF market has already fallen – by 20% or more in some posts. All I’m saying is that the data do not support that in any way, shape or form. They reveal that the market continues to climb slowly or, at worst, has plateaued. A rare anecdote where a pretty unique, high-priced place fetched a lower price a couple years later does not offset the mountains of contrary evidence.
And with the markets at new highs, particularly the tech heavy NASDAQ, there certainly is no obvious red flag for an imminent decline in SF. Could happen, sure. But why would you think that it would?
The Bay area has had many boom bust cycles and will probably continue to have many more. There are many reasons for this, but one large one is that there’s a lot of positive feedback on the upside. Not least of which is price momentum. It’s much easier to stretch to buy into a rising market than to stretch to buy into a flat or falling market. You can sell shares of a $1B company which is hemorrhaging money if buyers expect it soon to be worth $2B, but who wants to buy into a pile of large losses when investor interest and valuations are waning?
It’s possible that this time is different and it will be a boom-flatten cycle not a boom bust, but there are many reasons why flatting out at a high valuation isn’t a stable situation.
Certainly, home prices could fall here. Again, all I’m saying is that the evidence overwhelmingly demonstrates that has not yet happened, contrary to numerous postings on this site. And with NASDAQ hitting new highs yet again today, continuing low unemployment and high earnings, and limited housing supply, I don’t see any reason to think a significant fall in SF is in the cards any time soon. But it certainly could happen.
Home prices did fall from late 2015 to late 2016 (the Case Shiller graph appears a bit sluggish compared to other more localized data). This is the median price I am talking about, some sectors were worse than others. It’s only this spring that we got the Trump Bump and new highs.
From 2010 through 2016, SF employment by an average 18,800 jobs per year.
But the for the 12-month period through June, employers created only 3,400 jobs, the slowest 12-month gain since April 2011. As mentioned before, the total labor force has actually declined recently and VC funding fell pretty hard. The recent bump in home values is probably due to price insensitive buying at low inventory levels, partly attributed to lower paying jobs replaced with higher paying jobs, and partly due to another big bump in foreign buyers per the best available national figures and anecdotal evidence. I think the labor and liquidity trends are probably more important here, and when combined with surveys that show residents are reeling from high cost of living and congestion, and lots of new construction supply coming online, I would not expect much further gains here.
So much focus on the headline where the top tier actually is pretty flat (0.1% decline? what is that?). No surprise on SS. The main headline here is that things are not going down.. but quite the contrary. I’m not in the camp that wants them to go higher, but need to accept the current state