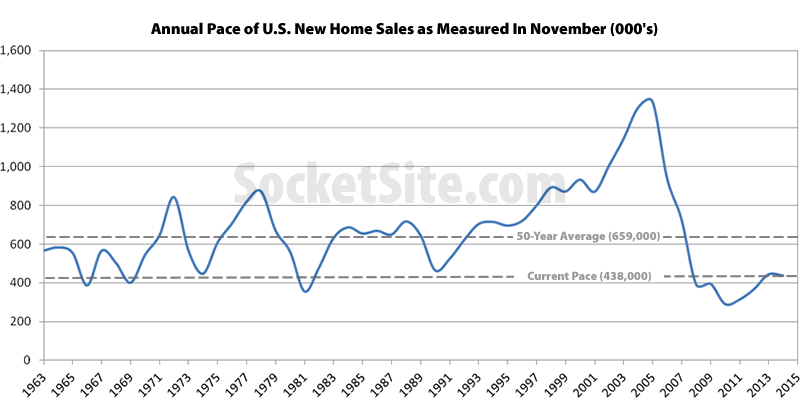
The seasonally adjusted annual pace of new single-family home sales in the U.S. slipped 1.6 percent in November to an annual rate of 438,000 as the October pace was downwardly revised from 458,000 to 445,000.
New home sales are now running at a pace which is 1.6 percent lower than at the same time last year and 33 percent lower than the average over the past 50 years (653,000). The pace of new single-family home sales in the U.S. as measured in November peaked at 1,336,000 in 2005, 67 higher than last month.
In the West, the pace of new home sales jumped nearly 15 percent from October to November and is running 10.7 percent higher versus the same time last year (versus 27.9 percent higher on a year-over-year basis last month).
And in terms of inventory, the number of new single-family homes for sale in the U.S. is currently 16.0 percent higher than at the same time last year, with the greatest number of new homes on the market (213,000) since 2010.

hmm…long-standing pattern…posts that poke the bubble get no replies, as if to silently convey to the editor that non-booster posts will get no traffic.
c’mon socketheads, prove me wrong!
The big bubble peaked in 2004-5 when we sold four times as many new homes as at the 2010-11 trough. Even the still weak forecast for 2014 is nearly 50% higher than 2011. The average over the past 15 years 2000-2014 is more than 700k. The dips in the graph correspond to recessions, the last one being the worst recession since the depression of the 1930s.
two beers,
I think this type of national news is generally quiet on the poster front. Particularly, when it is new homes which we have very little of and says the West is actually doing well.
The bubble you are hoping is poked (and popped) is local and not national. I don’t see this poking the local bubble at all.