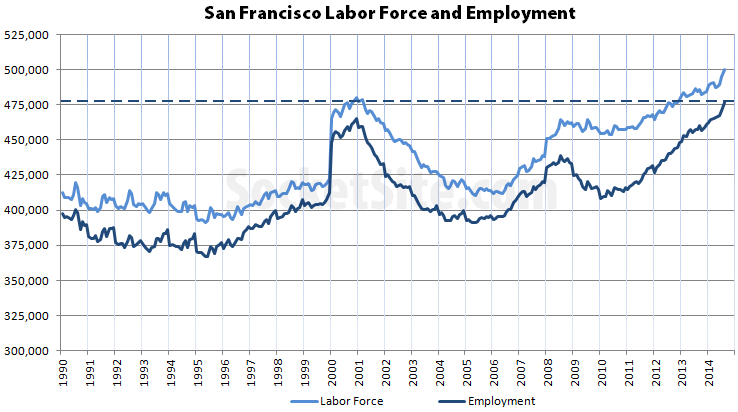
Employment in San Francisco has reached another all-time high as the number of residents with a paycheck increased by 1,300 last month and now totals 477,600 with an unemployment rate of 4.4 percent, the second lowest rate since 2008, according to California’s Employment Development Department.
That’s 17,600 more people employed in San Francisco than at the same time last year. And that’s and 12,100 more people than were employed in the city at the height of the dot-com peak in December 2000 when the unemployment rate measured 3 percent based on a labor force of 480,000 versus 499,400 last month.
The unemployment rate in San Francisco topped out at a little over 10 percent in January of 2010 when 69,900 fewer San Francisco residents were employed than today.
The unemployment rates in Marin and San Mateo dropped in September as well, to 3.9 percent and 4.1 percent respectively, as did the unadjusted unemployment rate for California which dropped from 7.4 to 6.9 percent.

Is the S.F. “labor force” based only on S.F. residents, or on people who could work in S.F.? I’m wondering in part how it relates to S.F. population (and what those current population figures are), but also because the graph shows a significant drop in labor force from 2001 to 2005, but I don’t think the City’s population shrank during that period (certainly not by that much, if so).
[Editor’s Note: It’s residents only for both numbers above.]
Tons of people showed up from 1997 to 2000 to participate into the dot-com frenzy. In 2001 many scrambled to stay there. The ones with less skills left. Many actually moved south to the big tech names that offered more safety. This is the drop from 2001-2005 that brought the #s back in line with the median.
The CA EDD SF labor force estimates are for residents of SF. I’m not sure what you mean by “could work in SF”.
Roughly 80% of employed SF residents work in SF, most of the rest commute to San Mateo and Santa Clara. Only about 55% of the people with SF as their place of employment are also residents of SF, most of the rest commute in from the east bay. This is all according to the US Census.
Also according to the US Census, SF population declined in 2005 to below the level of 1990 and SF lost over 7% of total population from 2000 to 2005:
Year SF pop (k)
1990 724
2000 777
2005 719
2010 805
we must be up to at least 840K by now
How can SF ever get near 4% unemployment? I’m around daytime and always see tons of people hanging around. Either well off flaneurs or more commonly all those people on assisted living, not to mention transients and homeless. Are all those people counted too? There are lots, and I mean lots of people living of disability, etc. that hang out in SRO’s or one of the hundreds of assisted living programs. Walk down mission ~ 16th st, tenderloin or soma ~ 6/7th, and you’d think that everyone is on a permanent vacation!
The unemployment rate only counts people who are actively looking for work. People on disability are not counted.
population was increasing throughout the bear market, people were increasingly working in tech in SF, and VC was continuing to be bullish on tech. all things that bulls on here nailed, and bears on here got utterly wrong
Could you site a source? I thought population in the city went down in the last recession?
US Census SF population (100% count for 2010, 1-year ACS for each year of 2006-2009 and 2011-2012):
2006 744,041
2007 764,976
2008 808,976
2009 815,358
2010 805,235
2011 812,826
2012 825,863
There was a slight decline around 2009-2010 and overall looks like a three year pause 2008-2011 with strong growth before and after.
Remember the census is only done every 10 years (1990, 2000, 2010), and every other year is just an estimate. Estimates are often quite off by the end of the decade.
All these Census stats are estimates. The decennial census has a smaller margin-of-error than the one-year ACS because it has a larger sample and takes more care to make the sample representative, but it is still an estimate.
Even allowing for the worst case of the MOEs to be inversely correlated, there was a slight decline in the SF population during the last recession. As a percentage it was less than the decline in employment, but that happens in most recessions in SF.
Also, the ACS is a stand alone estimate. It does not drift from the decennial and then get calibrated every 10 years. I’m not aware of the US Census data for SF being “quite off by the end of the decade”, but would be interested if you have examples.
There is a published study (pdf at namelink) of how the 2000 census differed from the ACS for SF. Most of the statistically significant differences are in the detail breakdowns not the aggregate population numbers, e.g. share of the population by race or disability status.