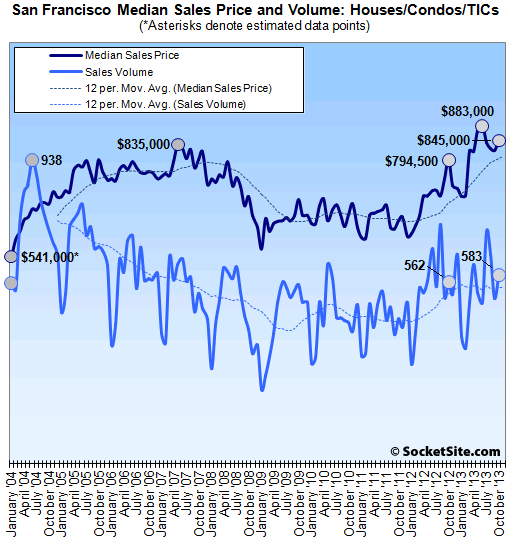
Having dropped 21 percent on a year-over-year basis in September, recorded sales activity for San Francisco homes ticked up 3.7 percent on a year-over-year basis in October, up 14.1 percent from September and versus an average seasonal gain of 3.4 percent over the past ten years.
Having dropped for three months in a row, the median price paid for a home in San Francisco ticked up 3.0 percent in October to $845,000 and is up 6.4 percent on a year-over-year basis, the smallest year-over-year change since July of 2012. Keep in mind that while movements in median sales price are a great measure of what’s in demand and selling, they’re not a great measure of actual appreciation despite what many headlines might say.
For the greater Bay Area, recorded sales volume in October gained a seasonal 6.4% from September but fell 3.9 percent year-over-year while the median sales price gained 1.8 percent to $539,000 in October and is up 29.7 percent year-over-year.
Foreclosure resales and short sales made up 14 percent of the Bay Area market in October, up from 12.2 percent in September but versus 35 percent at the same time last year.
As always, keep in mind that DataQuick reports recorded sales which not only includes activity in new developments, but contracts that were signed (“sold”) months prior but are just now closing escrow (or being recorded) and any properties that were sold “off market.”
∙ Bay Area Home Sales Ease Back; Median Sale Price Edges Higher [DQNews]
∙ Home Sales In San Francisco Slip Again In September [SocketSite]

Looks like the once-oft-touted-here-as-a-much-better-measure-of-appreciation, median per sq foot, is showing an even rosier picture, and has hit all time highs in each of the first two Mondays in November, as per Redfin.
Currently up around 17% YOY.
Anyone care to measure the 24 month and 36 month changes in median gains/declines? Rough data points but still an impressive run.
Anyone care to measure the 24 month and 36 month changes in median gains/declines?
The 24 month change is +33 percent, the 36 month change +29 percent. In other words, over 80 percent of the change was between 2011 and 2012 and the rate of change is on the decline.
I’m glad to see things leveling off, even though I own my home. Prices have been going up way too fast to be sustainable, I’d much rather have a reasonable market. Some of it is certainly from the flood of investment money flooding into the bay area via venture capital & IPOs, but it’s gotten out of hand!
Thanks. Declines from all time highs. One thing is for sure and that is our fiscal policy is clearly focused on keeping housing prices afloat. It interesting to see how this has impacted the high end and ultra high end.