While the pace of increases continues to slow from the record setting gains recorded in April and May, single-family home and condo values in San Francisco continued to tick up in August.
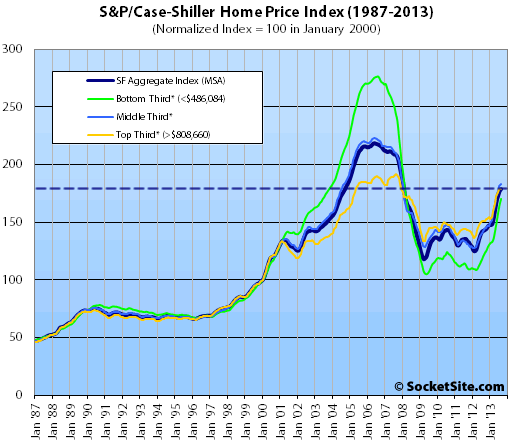
According to the latest S&P/Case-Shiller Home Price Index, single-family home values in the San Francisco MSA rose 0.9% from July to August 2013. Up 25.4% year-over-year, the San Francisco Index remains 18.2% below a May 2006 peak.
For the broader 10-City composite (CSXR), home values gained 1.3% from July to August and are up 12.8% year-over-year but remain 21.0% below a June 2006 peak.
“Las Vegas and California continue to impress with year-over-year increases of over 20%. Denver and Phoenix posted 20 consecutive annual increases; Miami and Minneapolis 19. Despite showing 26 consecutive annual gains, Detroit remains the only city below its January 2000 index level.
The monthly percentage changes for the 20-City composite show the peak rate of gain in home prices was last April. Since then home prices continued to rise, but at a slower pace each month. This month 16 cities reported smaller gains in August compared to July. Recent increases in mortgage rates and fewer mortgage applications are two factors in these shifts.
Denver and Dallas again set new highs. All the other cities remain below their peaks. Boston and Charlotte are the two MSAs closest to their peaks with only 8-9% left to go. Las Vegas is still down 47.1% from its peak level.”
On a month-over-month basis, prices ticked up across all three San Francisco price tiers but only nominally for those in the top tier.

The bottom third (under $486,084 at the time of acquisition) gained 3.0% from July to August (up 40.6% YOY); the middle third gained 1.0% from July to August (up 28.6% YOY); and the top third (over $808,660 at the time of acquisition) gained 0.1% from July to August, up 18.5% year-over-year versus 18.8% in July.
According to the Index, single-family home values for the bottom third of the market in the San Francisco MSA are back to June 2003 levels (38% below an August 2006 peak); the middle third is back above August 2004 levels (18% below a May 2006 peak); and the top third remains just above April 2005 levels and 6% below its August 2007 peak.
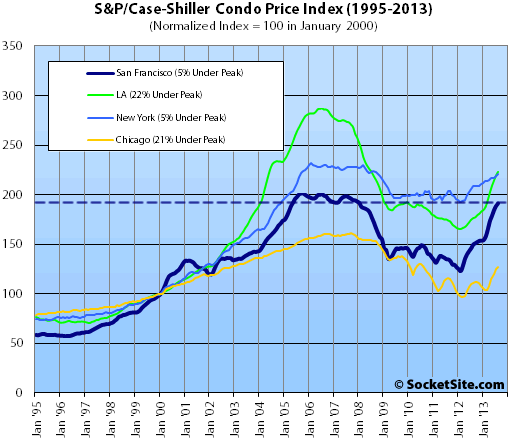
Condo values in the San Francisco MSA rose 1.4% from July to August 2013 and are up 27.7% year-over-year, within 5.0% of their December 2005 peak.

Our standard SocketSite S&P/Case-Shiller footnote: The S&P/Case-Shiller home price indices include San Francisco, San Mateo, Marin, Contra Costa, and Alameda in the “San Francisco” index (i.e., greater MSA) and are imperfect in factoring out changes in property values due to improvements versus appreciation (although they try their best).
∙ Home Prices Rise Further in August 2013 [Standard & Poor’s]
∙ San Francisco’s Top Tier Homes And Condos Within 6% Of Peak [SocketSite]
One of the other 2bd/1ba units in my complex just was listed, asking $499k, which is about 3% higher than I paid back in Feb 2007. Highest sale price I remember seeing was $505k in summer 2007. It will be interesting to see if it sells at that price. Last 2bd unit that sold in the complex was in March 2011 and that went for $395k.
For the longest time it seemed the recovery had skipped my place, but if this sells anywhere close to asking then it would seem my place is back in line with the general market.
It’s interesting to note that proir to 2001 the tiers were closely grouped, and moved almost in lock step. They then diverged tremendously, and 12 years later, they are almost all back to lining up again.
Normalized Index = 100 in January 2000
Sure, but they returns were nearly in lock step going back as far as the chart goes, whereas they wildly diverged between 2001 and this year, as can clearly be seen looking at the chart for SF prices. There were small divergences, but nothing close to what happened in the last decade.
Definitely can see a significant slowdown from the Spring frenzy (more than just seasonal as last Fall you could already see the frenzy building). I hope, as it looks may be happening, things moderate from here and we see the typical gains at about the inflation rate. We really don’t need another bubble and inevitable crash now.
The gains are trickling down rather than petering out, as can be seen from the tiers.
The crash started at the bottom and worked its way up, the recovery the reverse.
Better parts of SF = Last In, First Out.
This is a great chart and great data that I can use to gauge the best time to sell my flip in Santa Clara. Apparently, the best time to do that will be “Never” since appreciation significantly exceeds my holding costs.
JTHF, you may be right about the result, but don’t forget to take into account another important consideration – alternative investments, or opportunity costs. As one example, my SF house appears to have appreciated by about 25% since we bought it two years ago – great, I’m happy about that (although with property taxes, interest, etc., the real return is lower – yes, I know about leverage). But my stocks are up about 60% in that same timeframe (see why I took out a big mortgage at under 4% when I could have afforded to pay cash?). And the holding costs of my stocks are basically zero – no property taxes, no maintenance, no utilities, etc.
My bet is that in the coming year, and two years, stocks will greatly outperform bay area real estate. I’m not selling my house because we live there and we really like it as a place to live. But if my house were purely an investment vehicle, I think I’d sell today and put the money elsewhere where I think the returns will be much better.